Monitoring MySQL with Coroot
First impressions
First approach
I have being trying to test the MySQL monitoring feature since Coroot announced that it is suported. If you are not yet familiar with Coroot, the elevator pitch will be something around this lines: “An observability tool, heavily based on eBPF, so no one have to deal ever again with confusing instrumentation”. More on https://coroot.com/
So i just spinned a VM, installed docker and started to work. First was installing coroot. The Docker method is pretty straightforward (a docker compose), nothing weird there.
Next, the actual MySQL. Since i was already using docker, i went with the Percona Server for MySQL docker image. Also pretty simple. Once the contaner was running, i added artificial load with sysbench. And then the “magic”.
Related: For advanced sysbench configuration with ProxySQL and PXC, see How to Test ProxySQL Read/Write Split with sysbench
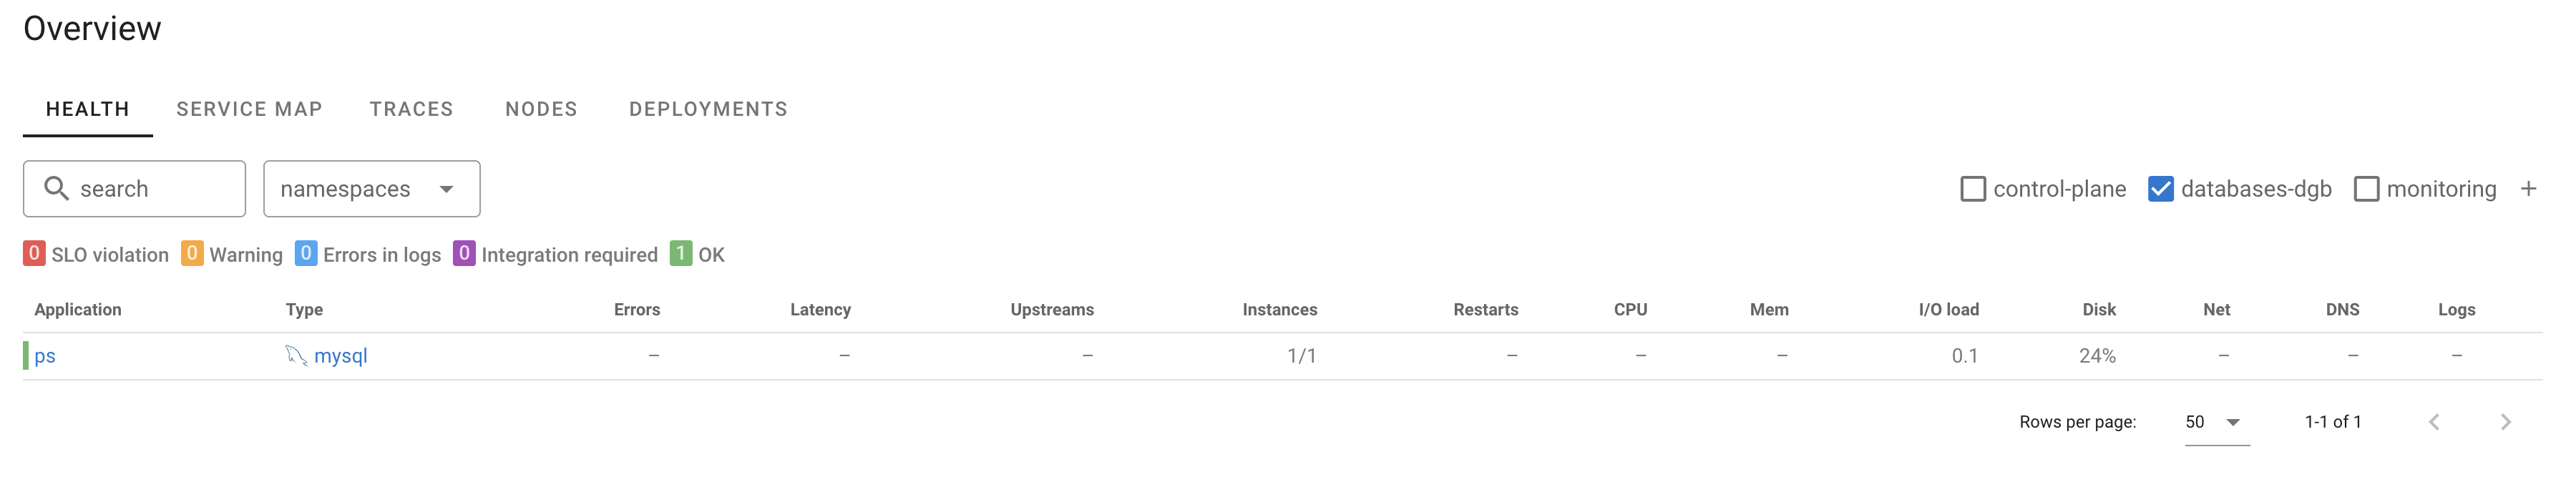
The node agent detected that there was a MySQL instance running. I didn’t have to do anything to add it to the monitoring. I did had to create a mysql user for coroot to connect thoug.
CREATE USER 'coroot'@'%' IDENTIFIED BY '<PASSWORD>';
GRANT SELECT, PROCESS, REPLICATION CLIENT ON *.* TO 'coroot'@'%';
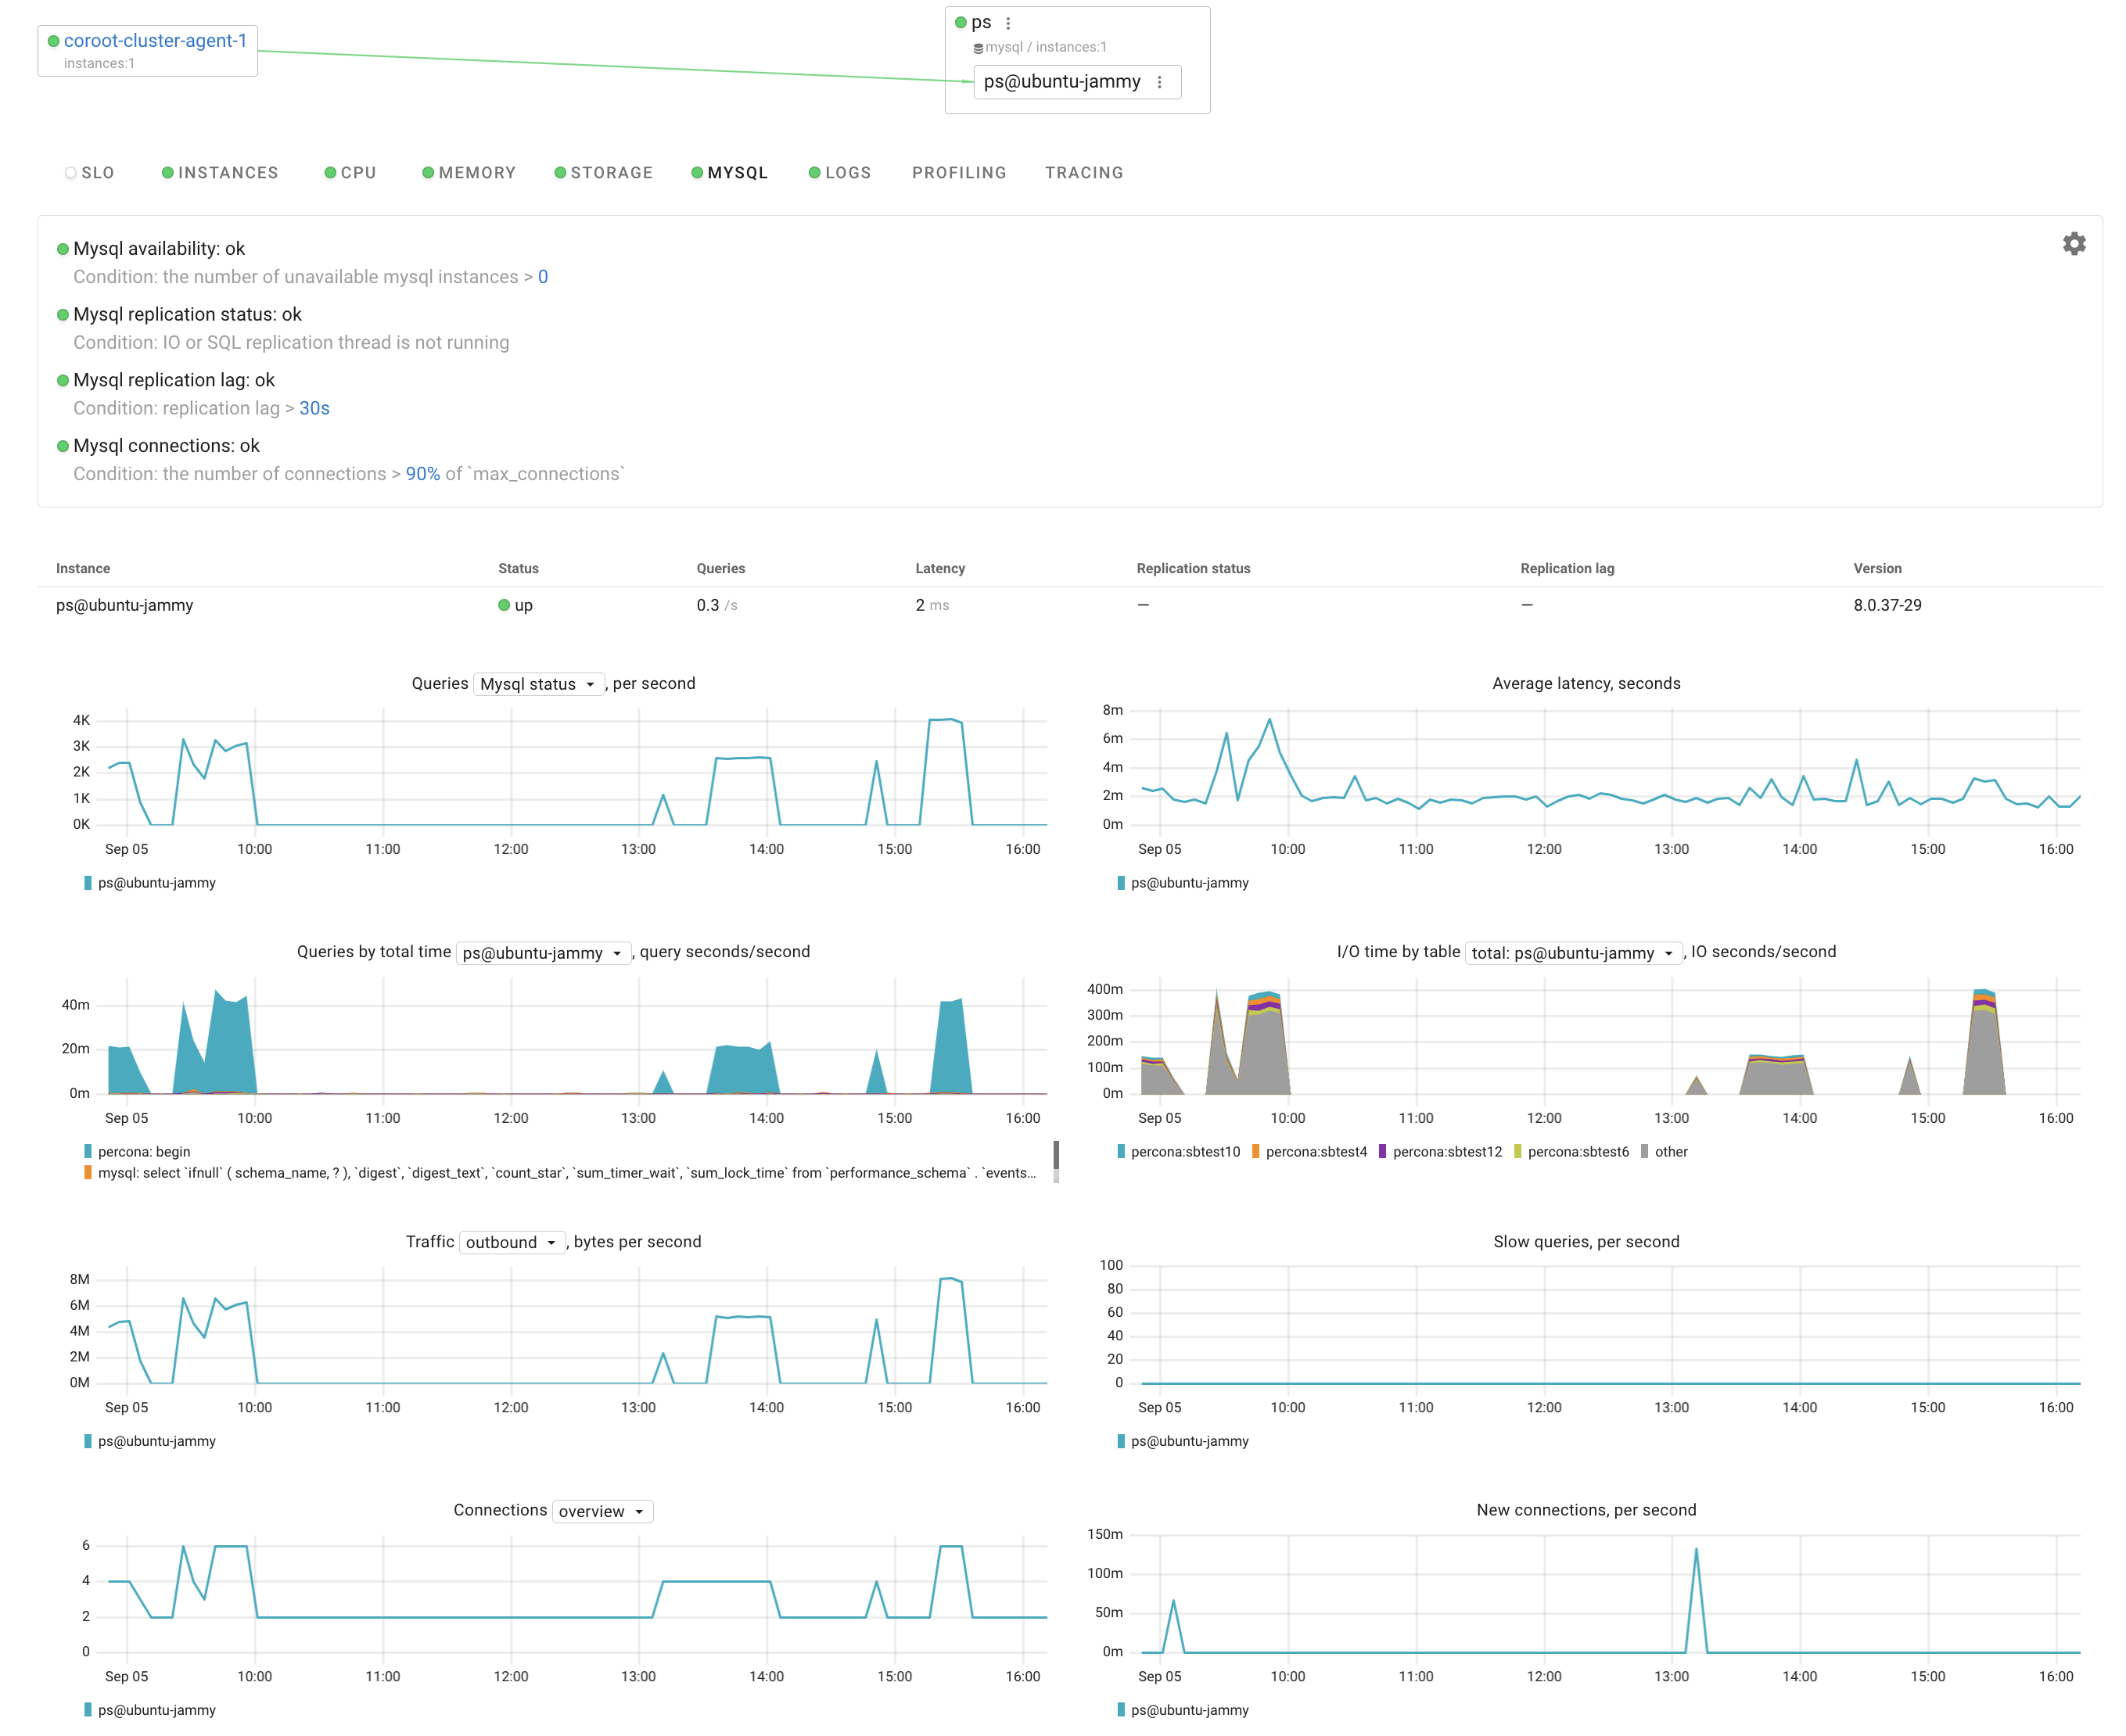
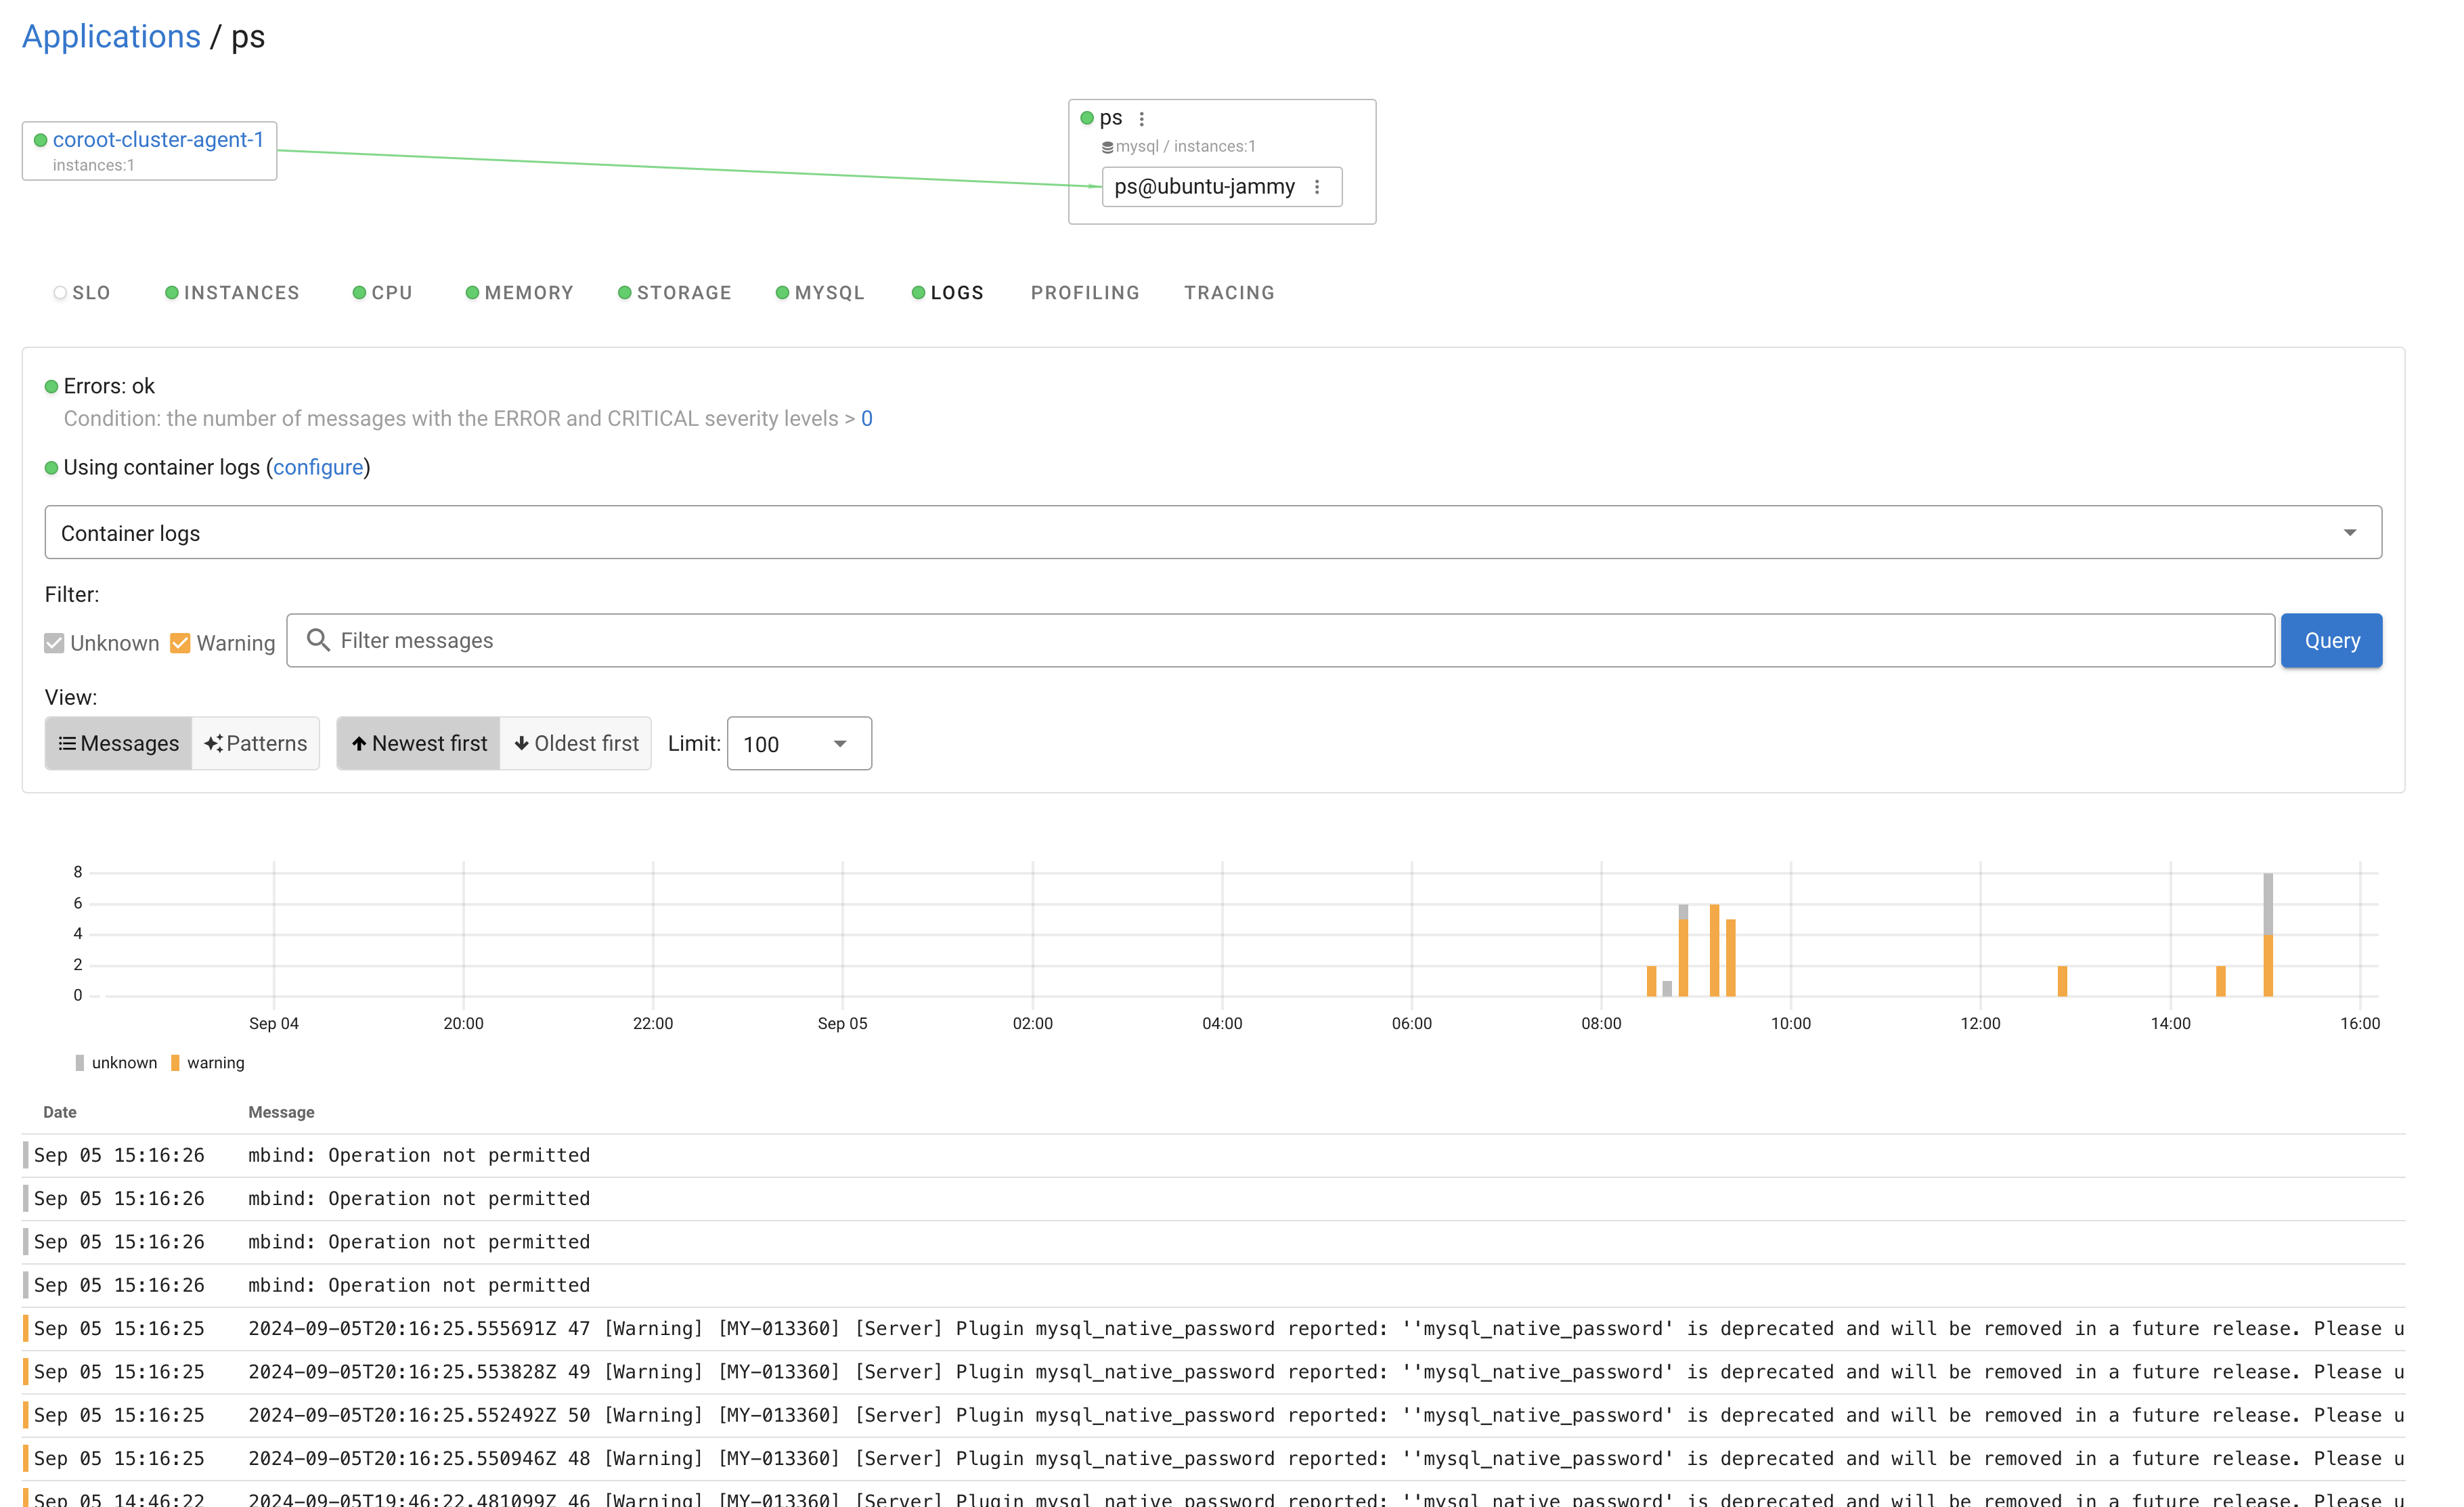
After a short time, i could see not only server level metrics but also MySQL metrics and Log info
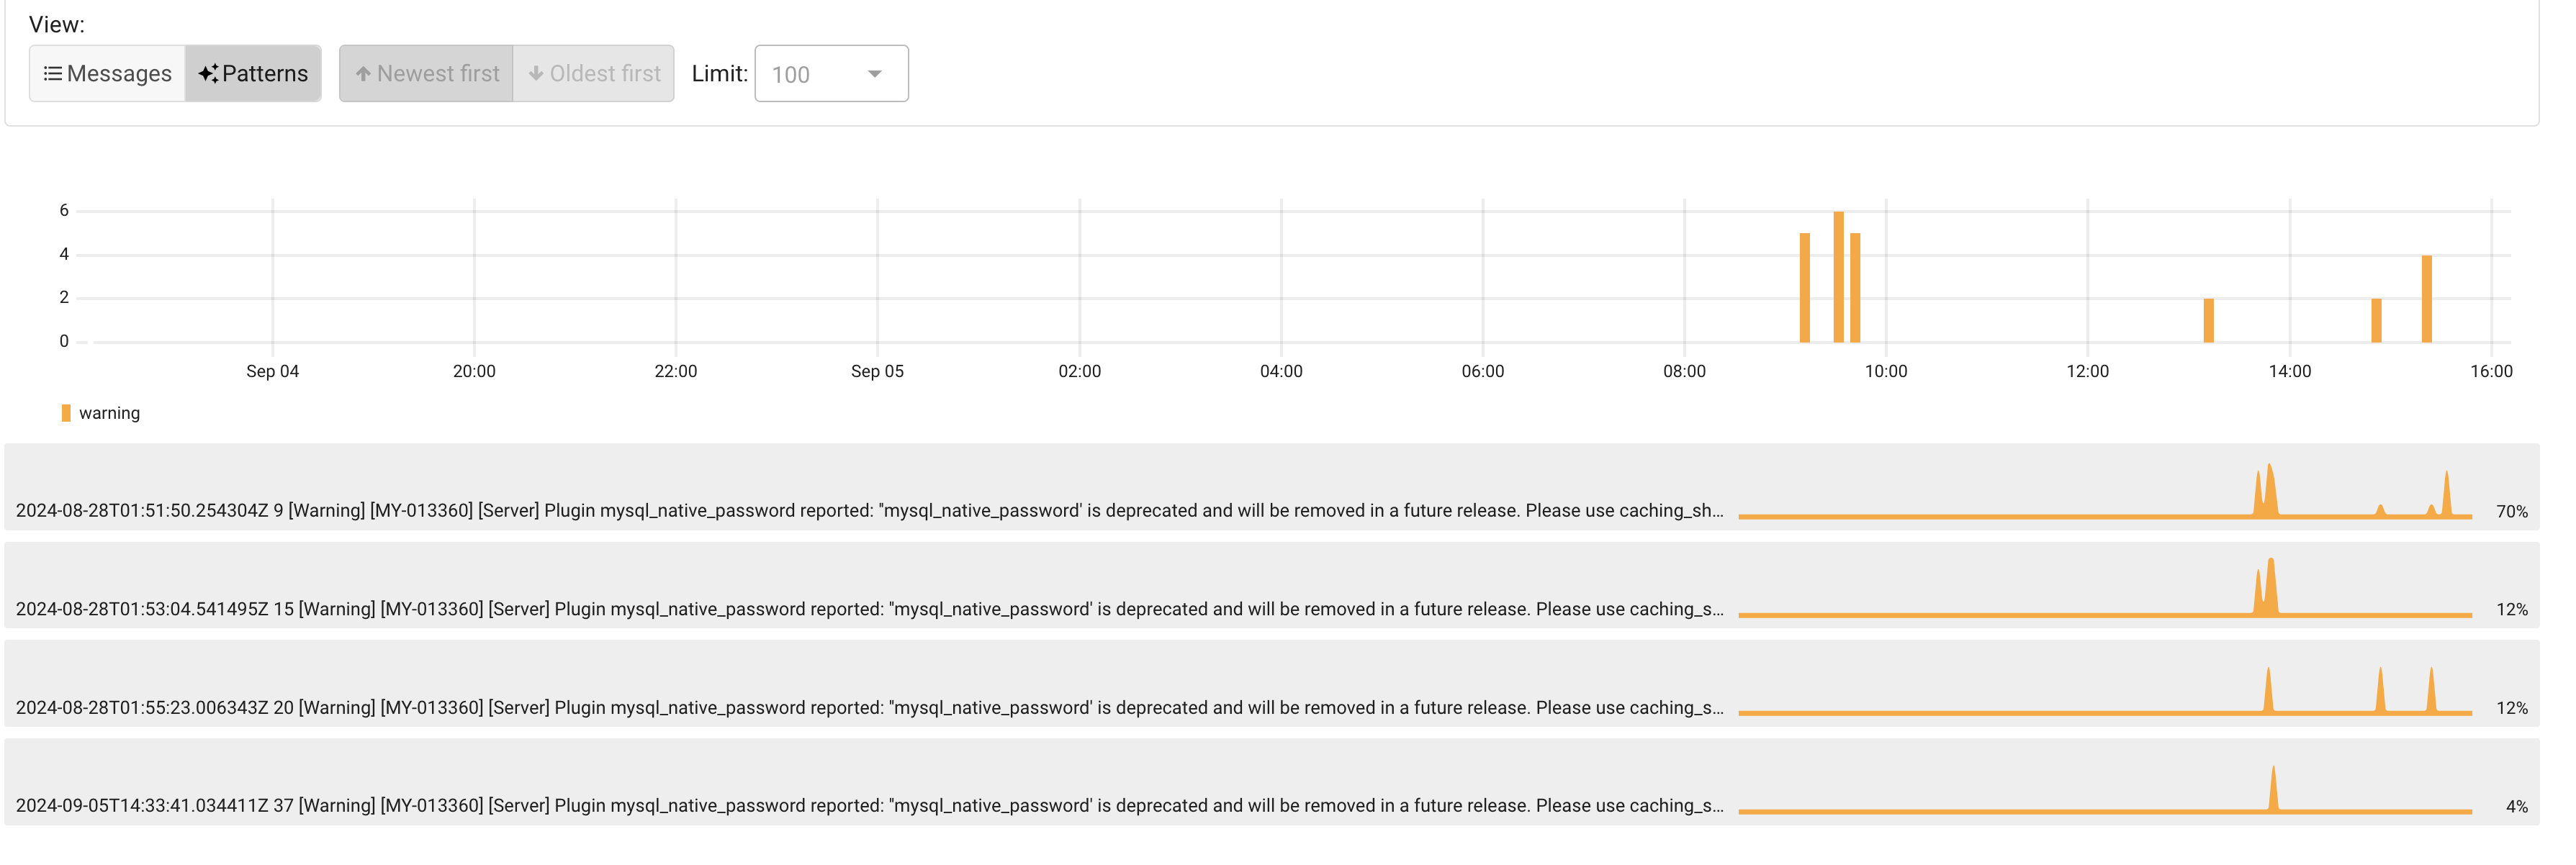
I like the “Patterns” feature, to help clean up a little bit the messages. Works like an aggregation
Testing for real
Now i wanted to see how Coroot presents some basic scenarios.
A long transaction
Just start a transaction, run some SELECT …. FOR UPDATE to lock rows and never commit nor rollback. At least not for a while.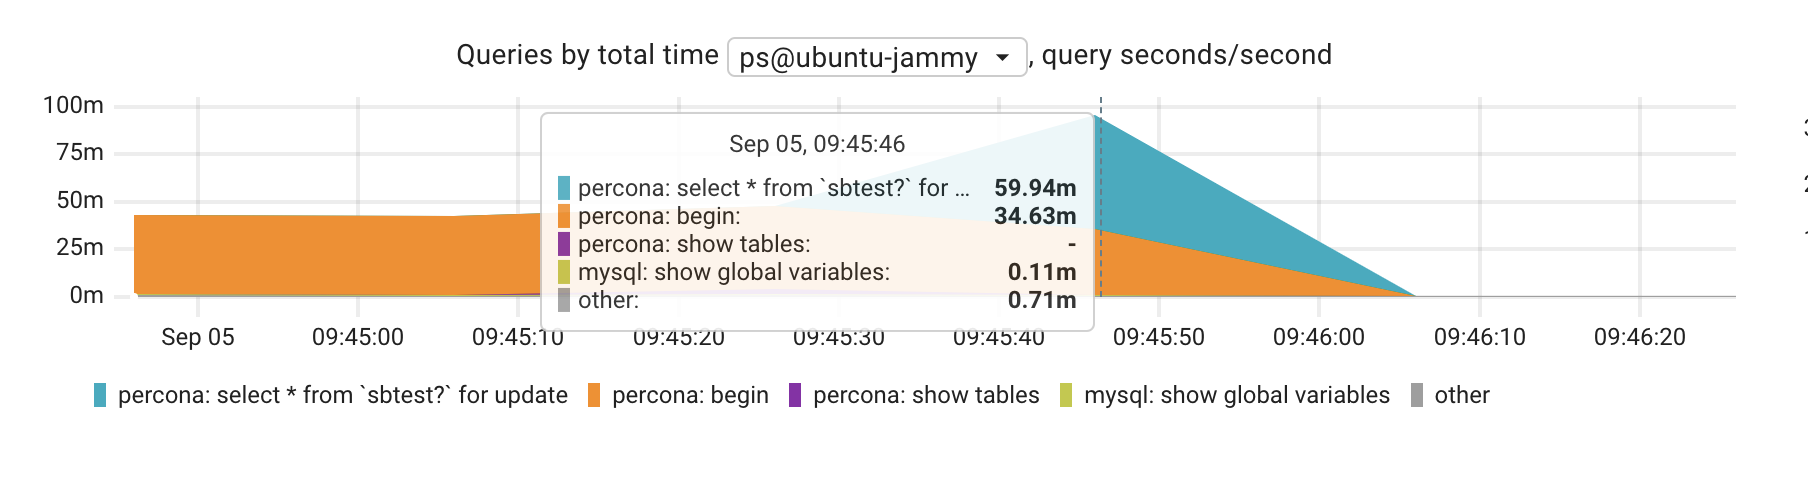
The graph “Queries by total time” is the one showing actual query info (and so far, the ONLY place that shows something related with queries, which is not enough). In there one can see that the dimension increases, demostrating that there is a slowness in the database. Each query is a series and the actual fingerprint can be seen as you hover the graph but also at the bottom.
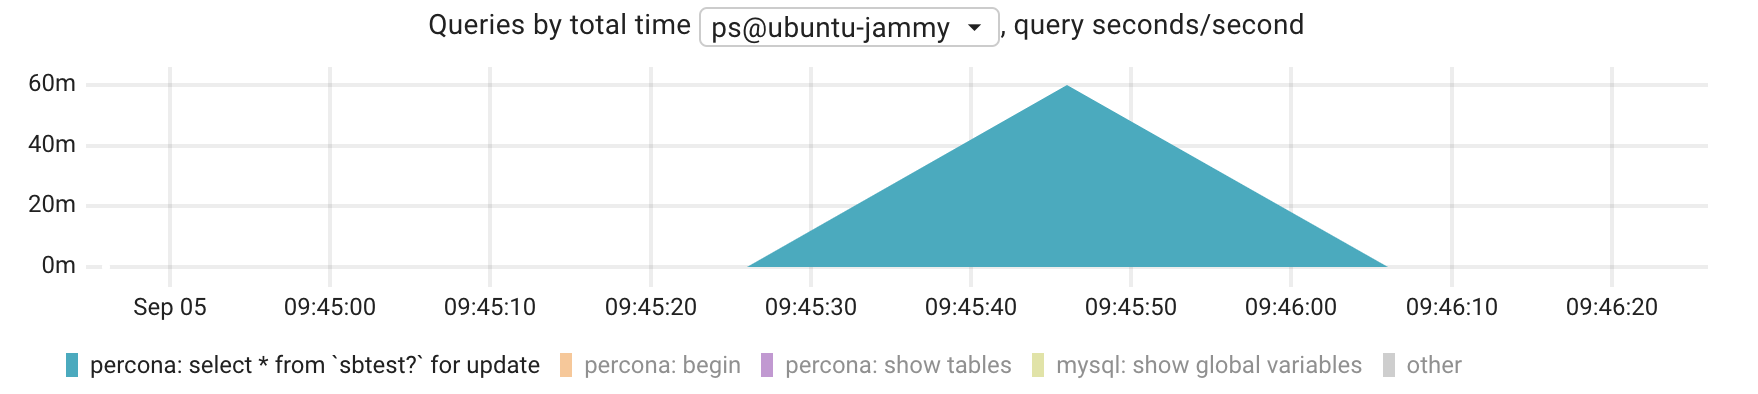
Is not clear for me why the decrease is also a symetrical line with a slope as the increase, when it should be more like a straight-is vertical line once the transaction is committed.
A slow lonely query
Now, what about a single query, no explicit transaction, being slow. For that i just ran a SELECT SLEEP
mysql> select sleep(3000);
^C^C -- query aborted
+-------------+
| sleep(3000) |
+-------------+
|           1 |
+-------------+
1 row in set (44 min 23.67 sec)

mysql> select sleep(300);
+------------+
| sleep(300) |
+------------+
|          0 |
+------------+
1 row in set (5 min 0.00 sec)
Actually, 2 of them. One cancelled. One ran the full length
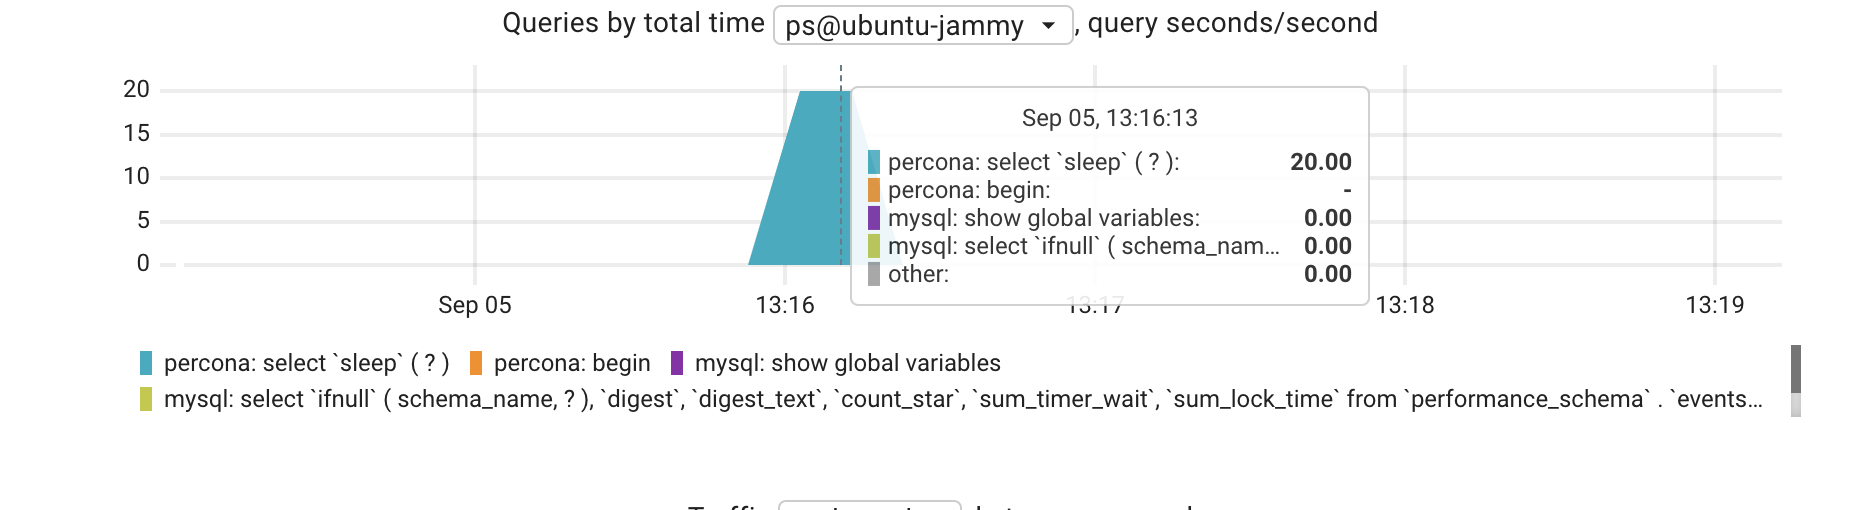
It is visible that the longest query in that range was the select sleep, but not sure what does the value of “20” means.
At this point is fair to say that Coroot is aware of query execution times and also that there are some improvement opportunities there.
Let’s move on to a different usage: Finding Bottlenecks.
Ethernal Love to FlameGraph
If you have never being exposed to the concept of FlameGraphs, it will be worth to take a detour and read Brendan Gregg’s documentation about it: https://www.brendangregg.com/flamegraphs.html
One of the things that i like the most about Coroot is the continuous profiling feature. The whole explanation of the feature can be read at https://coroot.com/docs/coroot-community-edition/profiling/overview but the important piece of information here is that spotting bottlenecks can become a simple task….with time. But once you are comfortable with this approach, is an one-way trip.
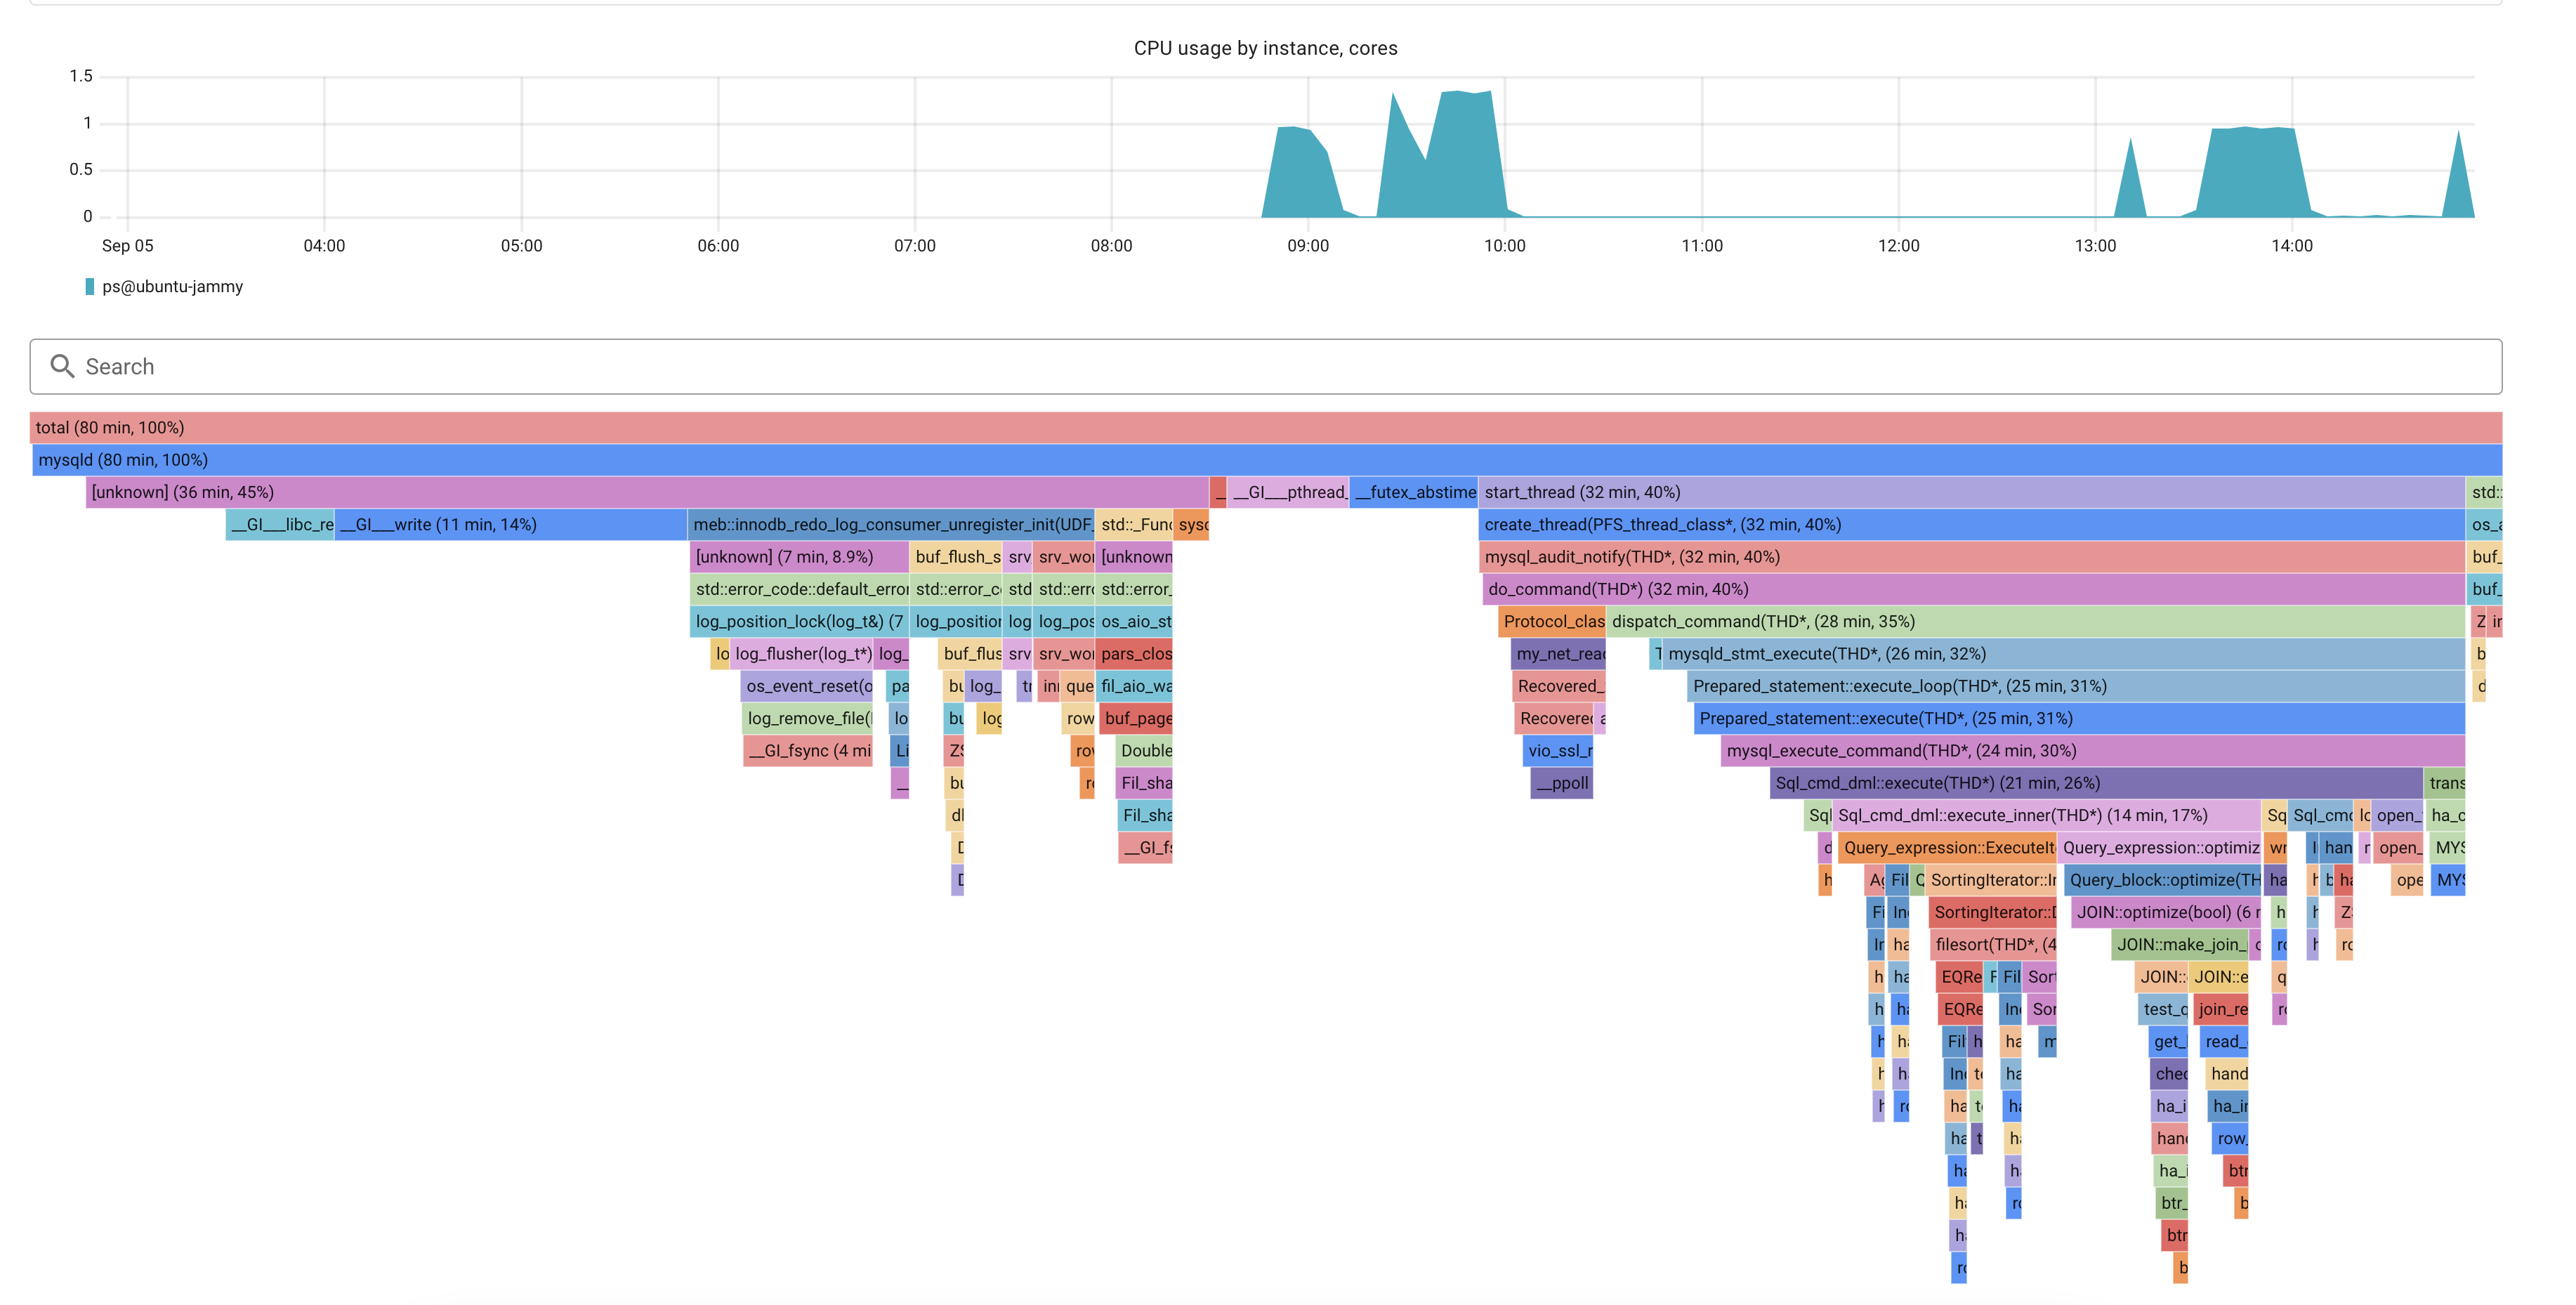
As i’ve mentioned earlier, i used Sysbench to create artificial traffic, but also i started using a MySQL with every variable using its default value. The CPU profiling for that looks like this
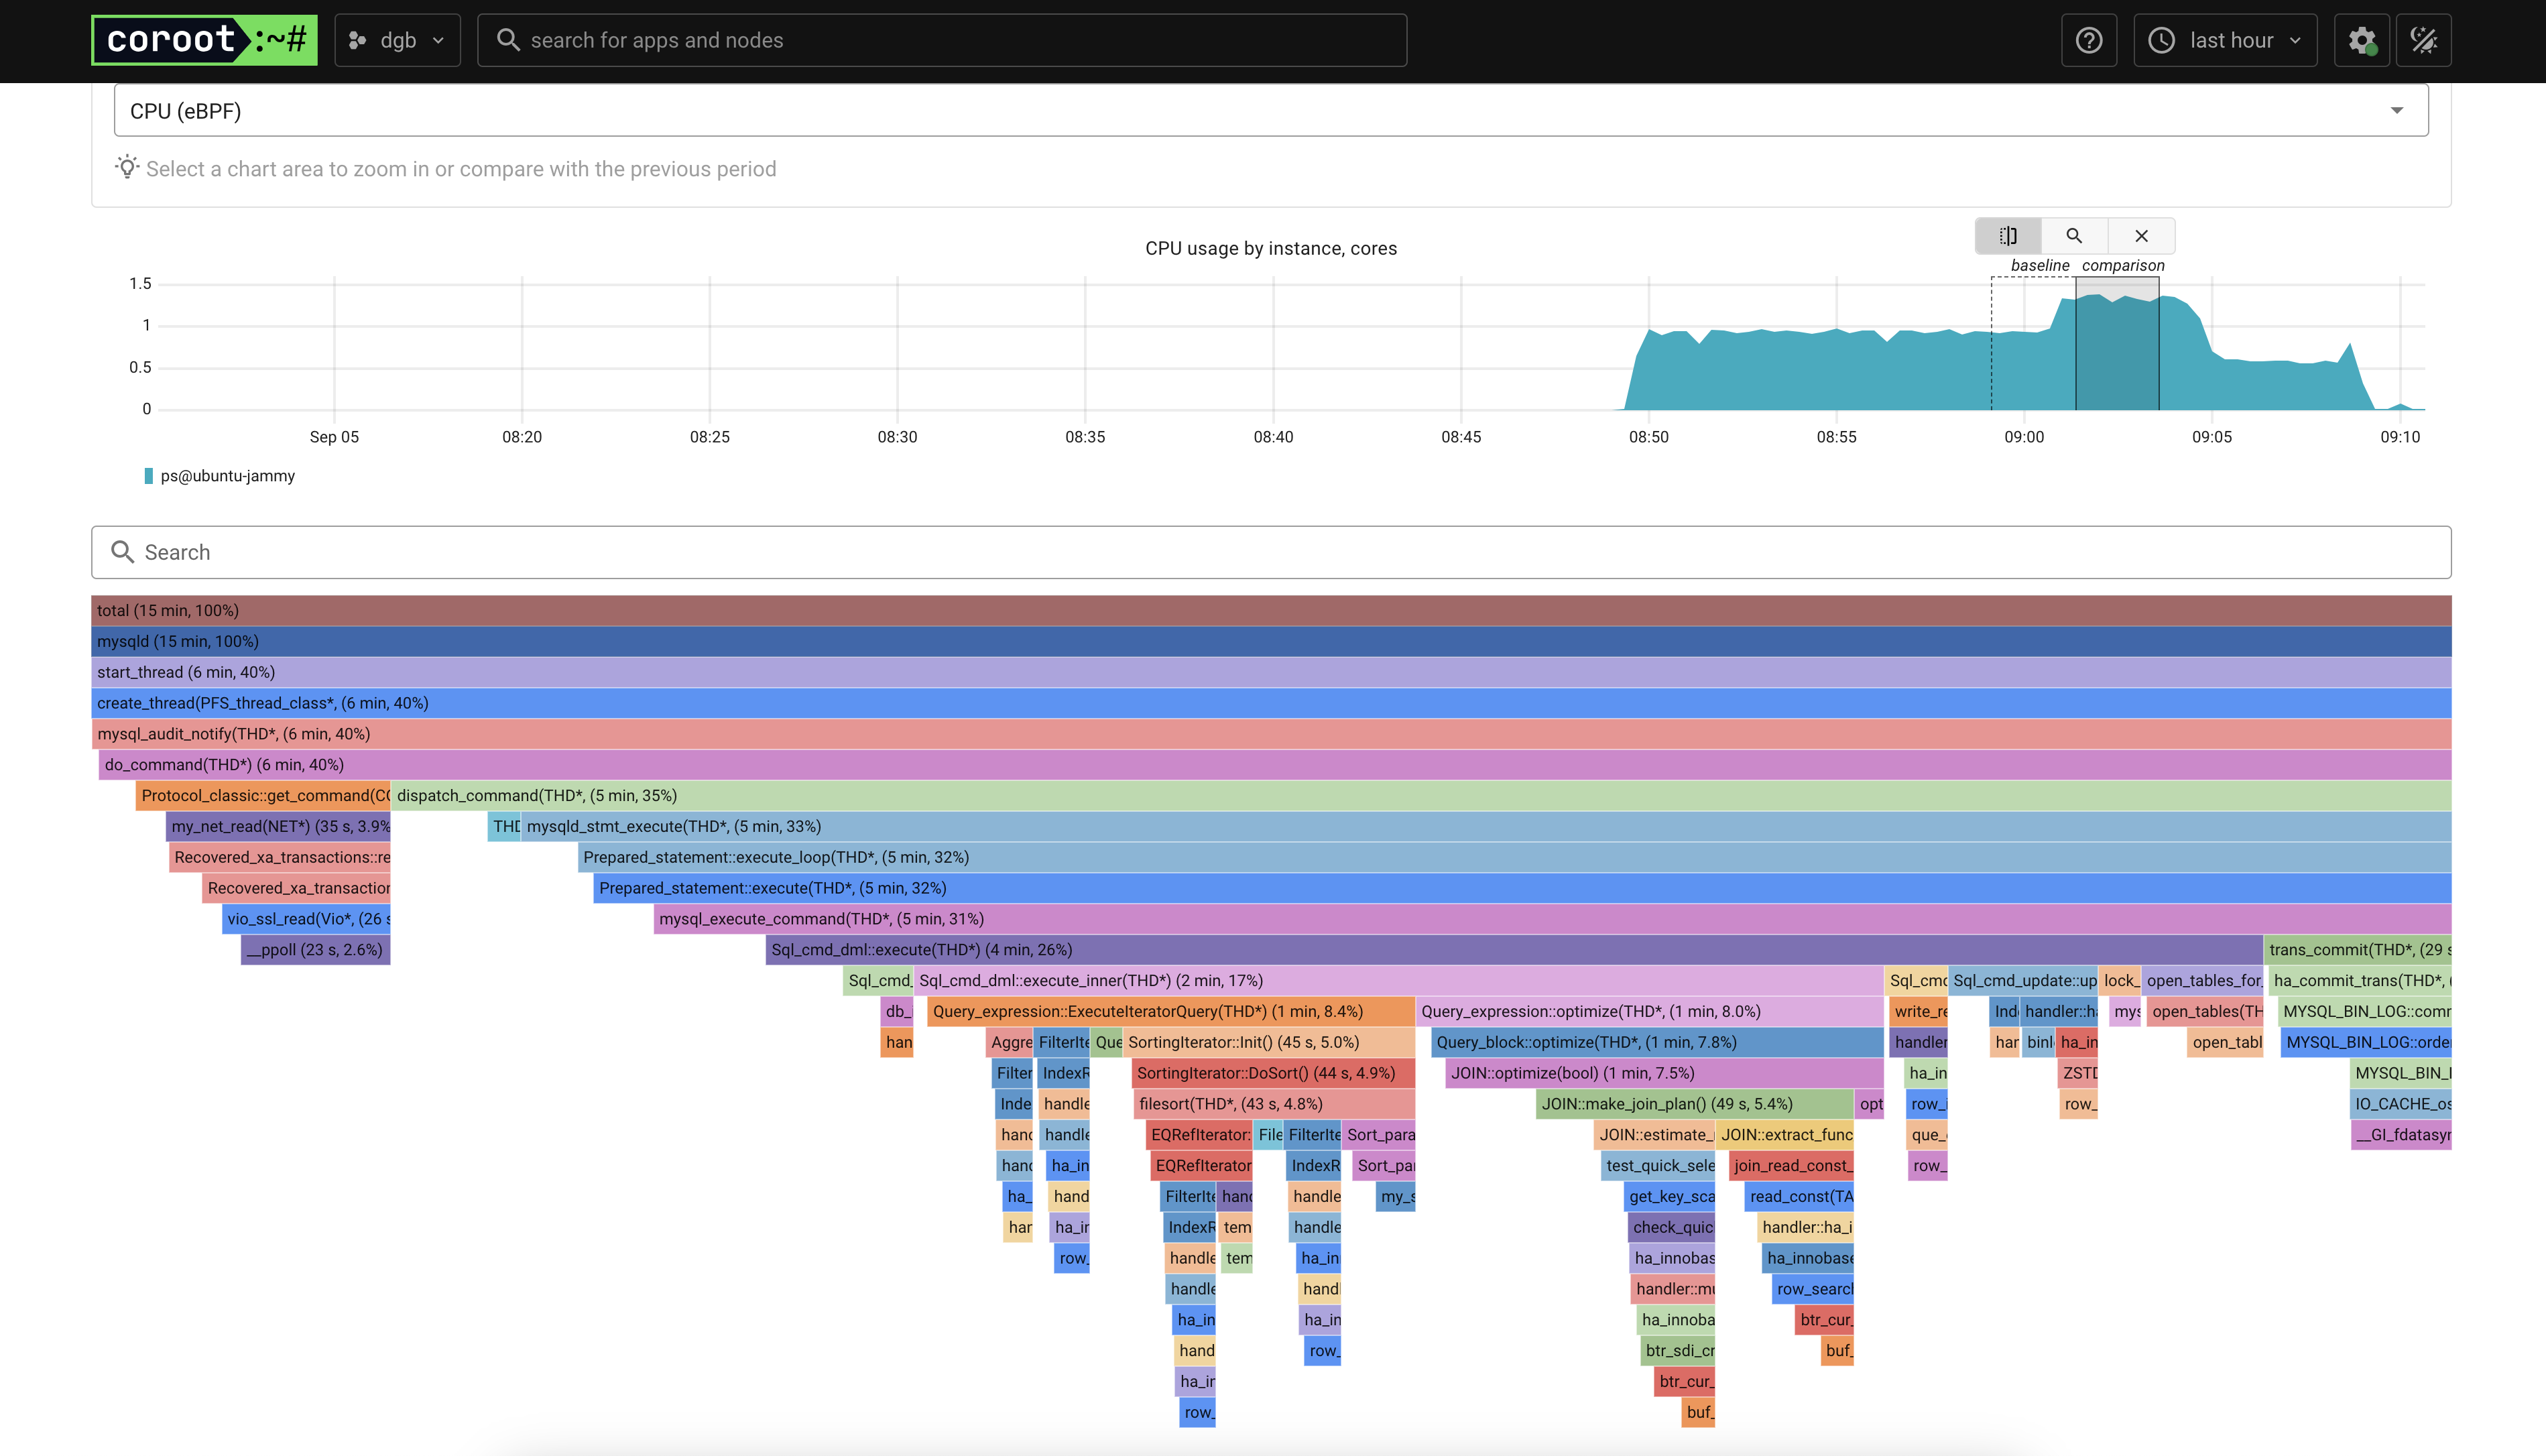
Finding Bottlenecks
Based purely on the FlameGraph, I identified bottlenecks in binlog sync and InnoDB log flushing.
Deep dive: For debugging InnoDB-specific contention using semaphores and source code analysis, see Contention in MySQL InnoDB.
Binlogs
The first thing that i noticed was the most-right stack, that looks like a Bin Log issue. By clicking the final call of the stack, one can see the following:
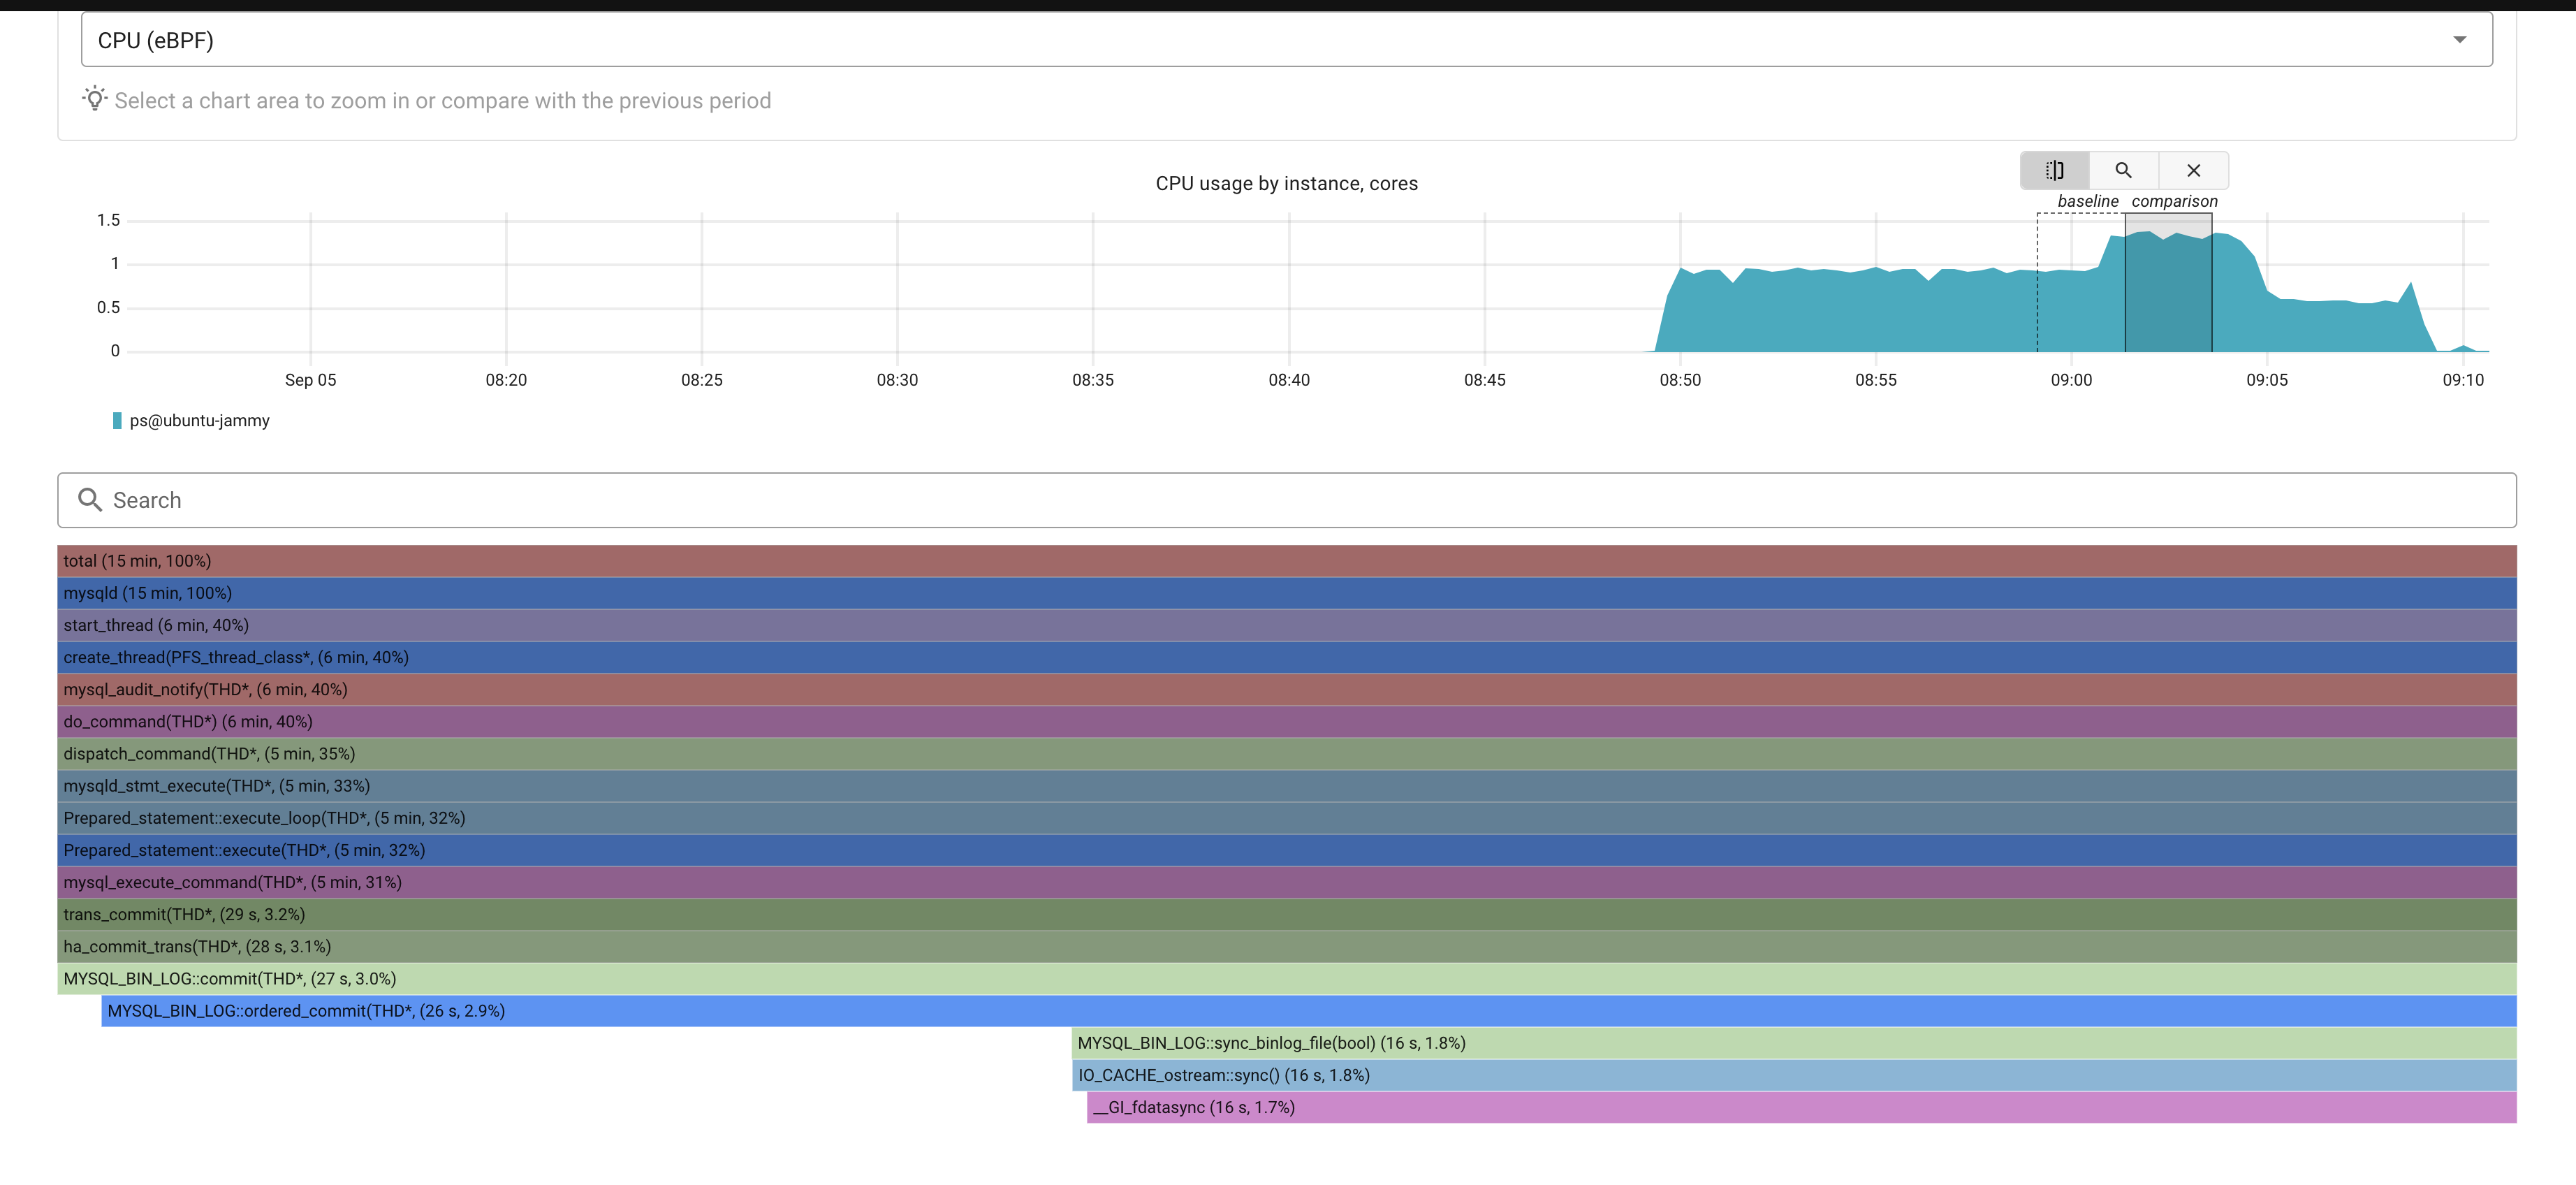
A simple inspection points to an issue with binlog file sync. Easy to change:
mysql> show variables like 'sync%bin%';
+---------------+-------+
| Variable_name | Value |
+---------------+-------+
| sync_binlog   | 1     |
+---------------+-------+
1 row in set (0.00 sec)

mysql> set global sync_binlog = 0;
Query OK, 0 rows affected (0.00 sec)

mysql> show variables like 'sync%bin%';
+---------------+-------+
| Variable_name | Value |
+---------------+-------+
| sync_binlog   | 0     |
+---------------+-------+
1 row in set (0.01 sec)
Let the traffic flow for a while and check again the profiler. Looks like this now:
One can see that the whole stack related to binlogs is now smaller. No longer a (major) bottleneck.
More FSYNCS
Now it seems that the biggest bottleneck is still around fsync() calls but on a different stack:
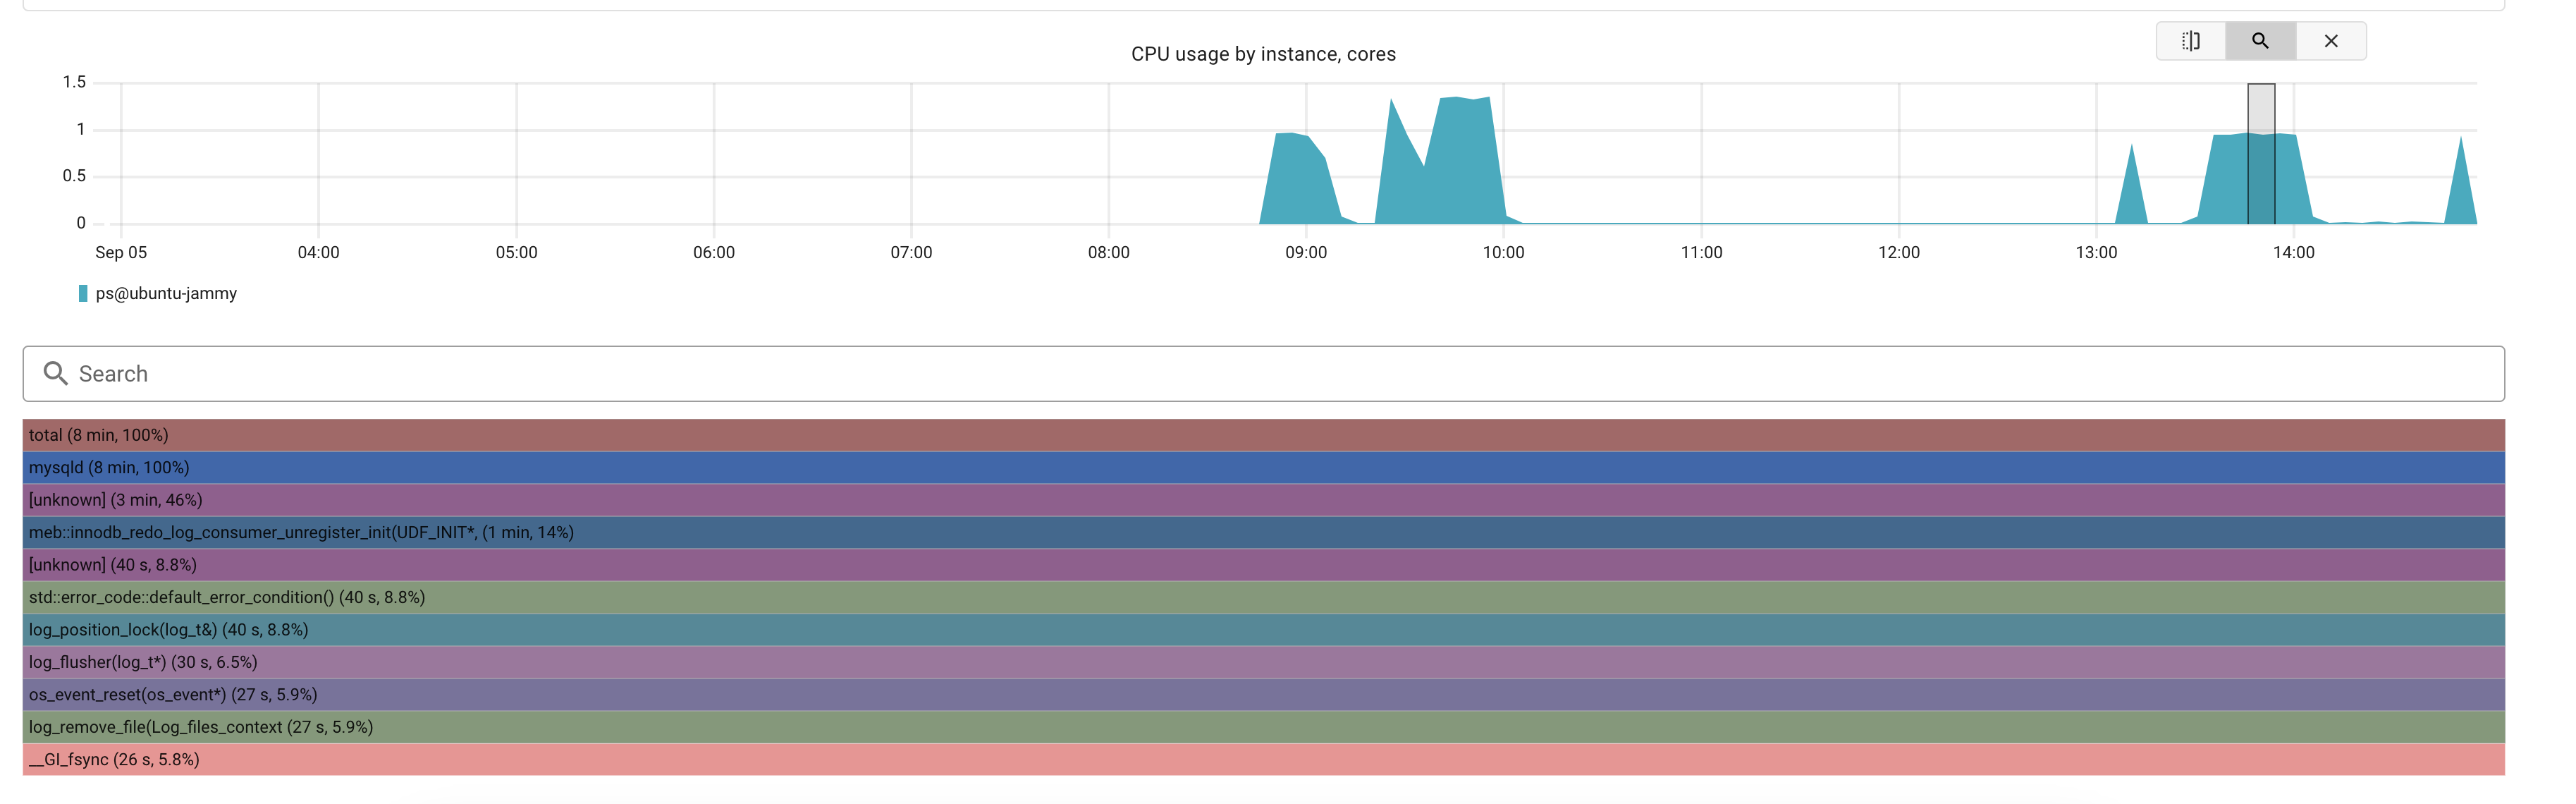
This one might not be trivial to spot. So let’s do some GitHub search on the Percona Server for MySQL repo: By searching for “log_remove_file(Log_files_context)”, “log_flusher(log_t*)” the following files and lines are found to be the relevants:
- hhttps://github.com/percona/percona-server/blob/646a7cf4b6874eb4a9163078febc13c7938328e1/storage/innobase/log/log0files_io.cc#L1018
- https://github.com/percona/percona-server/blob/646a7cf4b6874eb4a9163078febc13c7938328e1/storage/innobase/log/log0write.cc#L2502
What does it mean? Time spent on log rotation but mostly time spent on flushing logs. This comment on the code confirms it:
 -# [Log flusher](@ref sect_redo_log_flusher) - writes from OS buffers to disk
 (fsyncs).
The variable that governs this behaviour is innodb_flush_log_at_trx_commit
mysql> show variables like 'innodb%log%';
+------------------------------------+------------+
| Variable_name                      | Value      |
+------------------------------------+------------+
| innodb_api_enable_binlog           | OFF        |
| innodb_encrypt_online_alter_logs   | OFF        |
| innodb_flush_log_at_timeout        | 1          |
| innodb_flush_log_at_trx_commit     | 1          |
| innodb_log_buffer_size             | 16777216   |
| innodb_log_checksums               | ON         |
| innodb_log_compressed_pages        | ON         |
| innodb_log_file_size               | 50331648   |
| innodb_log_files_in_group          | 2          |
| innodb_log_group_home_dir          | ./         |
| innodb_log_spin_cpu_abs_lwm        | 80         |
| innodb_log_spin_cpu_pct_hwm        | 50         |
| innodb_log_wait_for_flush_spin_hwm | 400        |
| innodb_log_write_ahead_size        | 8192       |
| innodb_log_writer_threads          | ON         |
| innodb_max_undo_log_size           | 1073741824 |
| innodb_online_alter_log_max_size   | 134217728  |
| innodb_print_ddl_logs              | OFF        |
| innodb_redo_log_archive_dirs       |            |
| innodb_redo_log_capacity           | 104857600  |
| innodb_redo_log_encrypt            | OFF        |
| innodb_undo_log_encrypt            | OFF        |
| innodb_undo_log_truncate           | ON         |
+------------------------------------+------------+
23 rows in set (0.01 sec)

mysql> set global innodb_flush_log_at_trx_commit=0;
Query OK, 0 rows affected (0.00 sec)
Changed it from 1 to 0, let some traffic flows and check the profiling again:
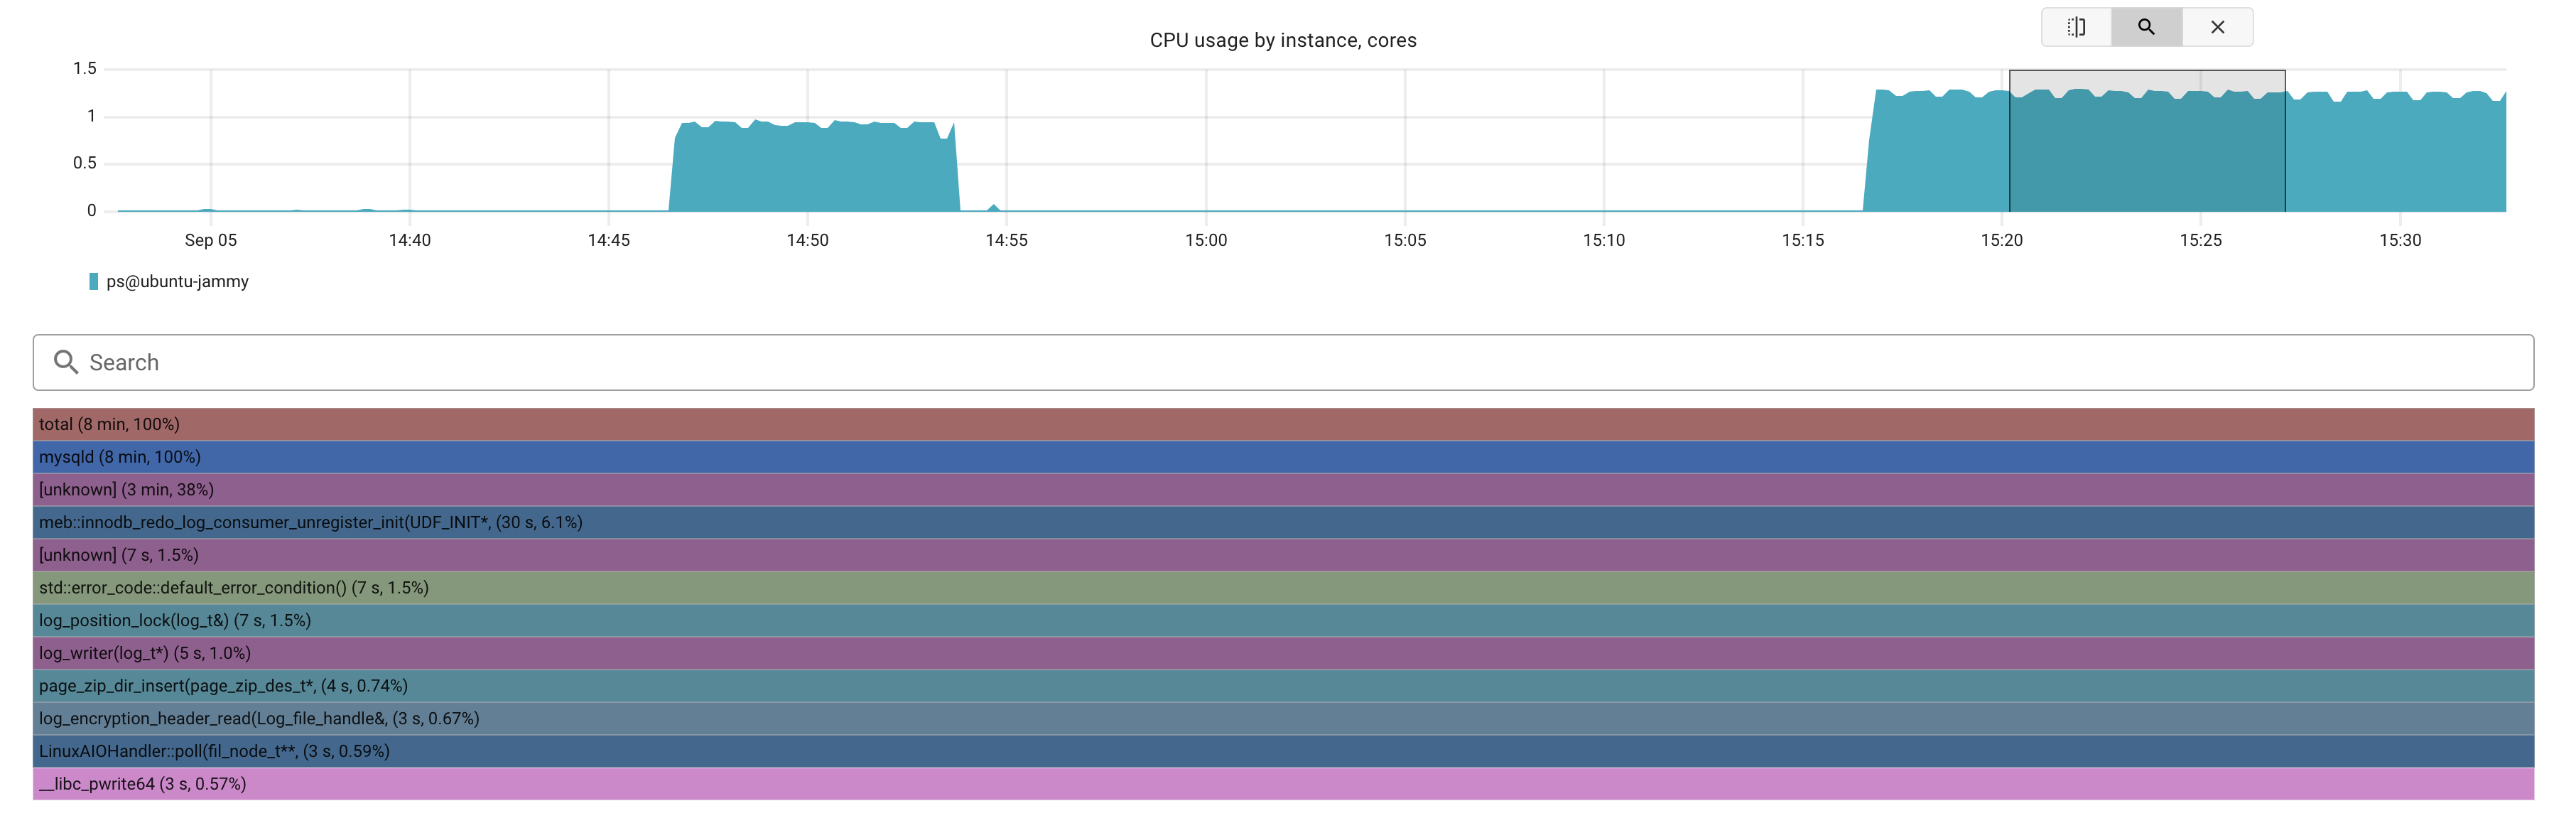
The time spent on flushing improved in 50%! that’s a lot. Pretty good for not having to look to endless metrics.
I will wrap it out here for the moment. There are more things to test, like replication monitoring or the alerting module, but that will be for a next blog.
In conclusion: Coroot have a massive potential and i’m sure that if they manage to figure out adoption, it will be a favorite between DBAs, specially on more complex deployments like Kubernetes Operators.
Related: For deep query analytics with custom dashboards beyond Grafana’s limitations, see Supercharge PMM Query Analytics: Using Redash to Optimize Database Performance.

Daniel Guzman Burgos
Colombia
Related Posts

PostgreSQL Internals for the MySQL DBA
You already know how a database works. This is about how a different database works.
March 31, 2026
The Claude Code Engineer
Ship more, type less
March 08, 2026
dbsafe in the Cloud: Safe Schema Changes on AWS Aurora and RDS
TLS connections, Aurora topology detection, and why gh-ost needs extra work here
March 06, 2026
Comments