Smart Alerting: Dynamic Thresholds
Combating Alert Fatigue
Smart Alerting: Combating Alert Fatigue with Dynamic Thresholds
Imagine a world where your phone never stops buzzing, your laptop constantly pings, and your smartwatch vibrates incessantly. Welcome to the life of an on-call engineer battling alert fatigue.
You know the importance of monitoring, but this alert storm is doing more harm than good. As you face another sleepless night, you can’t help but wonder: Is there a better way to keep systems running without sacrificing your sanity?
Probably.
Static world
When monitoring servers, the classic approach is to use alert rules with static thresholds. For example:
- 80% CPU usage: Warning alert
- 90% CPU usage: Critical alert
Then, to avoid getting alerted all the time that the condition is met, an “Evaluation Interval” is added. For example:
- Evaluate condition every 30s
- Condition must be TRUE for 3 consecutive times
If those rules are met, a SOFT (or firing, depending on what software you are using) alert will become a HARD (or active) alert: Positive for notification. Fire the alarms!
While static thresholds can be effective in certain scenarios, they come with limitations:
- They don’t adapt to changing conditions or patterns in system behavior.
- They often require frequent manual adjustments.
- They may not account for cyclical patterns (e.g., daily or seasonal variations).

Dynamic world
Modern times are dynamic! one needs to adapt or suffer extinction. Enter: dynamic thresholds. These are more advanced thresholds that will help to address many of the limitations of static thresholds. For example:
- Adaptive: They automatically adjust based on historical data and observed patterns.
- Time-aware: They can account for time-of-day, day-of-week, or seasonal variations.
- Anomaly detection: Instead of fixed thresholds, they can alert on deviations from expected behavior.
- Multi-dimensional: They can consider multiple metrics simultaneously to determine if an alert should be triggered.

Hands on!
Let’s use the same metric of CPU usage, but let’s make it dynamic. I used Grafana Alerting for this example, but the concept can be applied to other alerting managers.
I’m collecting and storing data on Prometheus, so we definitely need to use some PromQL. Nothing fancy, just this metric:
node_cpu_seconds_total
That metric comes from the node_exporter and is the one that stores the values of the CPU usage during time. To properly get the actual data, the following query is what we need:
sum by(cpu) (
  rate(node_cpu_seconds_total{mode!="idle"}[1m])
)
What is it querying?
- The CPU usage rate for each core
- Excluding “idle” time (I don’t wish to get alerted for that particular mode)
- Over the last minute
Then it does a basic arithmetic operation: Sums the rates for each CPU, so we can have the total non-idle CPU usage per core.
So far, we have the means to get the current value. Now, here’s the problem that static data misses: CONTEXT
The current value by itself is neither Good nor Bad (except for critical edge cases, but more on that later) so what provides context? Historical Data.
In our case we are going to use the values of the same metric, but X amount of time ago. How much X time ago? that will depend of your business case. Here is an example:
You are a ride-sharing platform like UBER or Lyft. The usage numbers of the platform on a Friday night are not the same for a Monday 10:00AM (i guess, i have no proof of that). We could say then that:
- A CPU usage around 85%-90% on a Friday night is EXPECTED.
- A CPU usage around 35%-40% on a Monday 10:00AM is also EXPECTED
- What is NOT EXPECTED is 85% on a Monday 10:00AM
So, for the ride-sharing platform case, we can replace X for “A Week Ago, same time”. How do we query that? with the slightly same PromQL, we just need to add
offset 1w
The full query will look like this:
sum by(cpu) (
  rate(node_cpu_seconds_total{mode!="idle"}[1m] offset 1w)
)
Now, we do the math. The Dynamic threshold will go around this lines:
Alert me if the current value is 30% bigger than the value of the same metric 1 week ago AND the current value is above 60%
The same way i’m chosing 30%, I could go with 20% or 40%. It will depend of how sensible you want the threshold to be.
The actual math in Grafana Alert looks like this:
$C > $D *1.3 && $C > 0.6
The whole alert rule looks like the above image. As you cann see, the timeseries values has to be “Reduced” so that grafana math works:
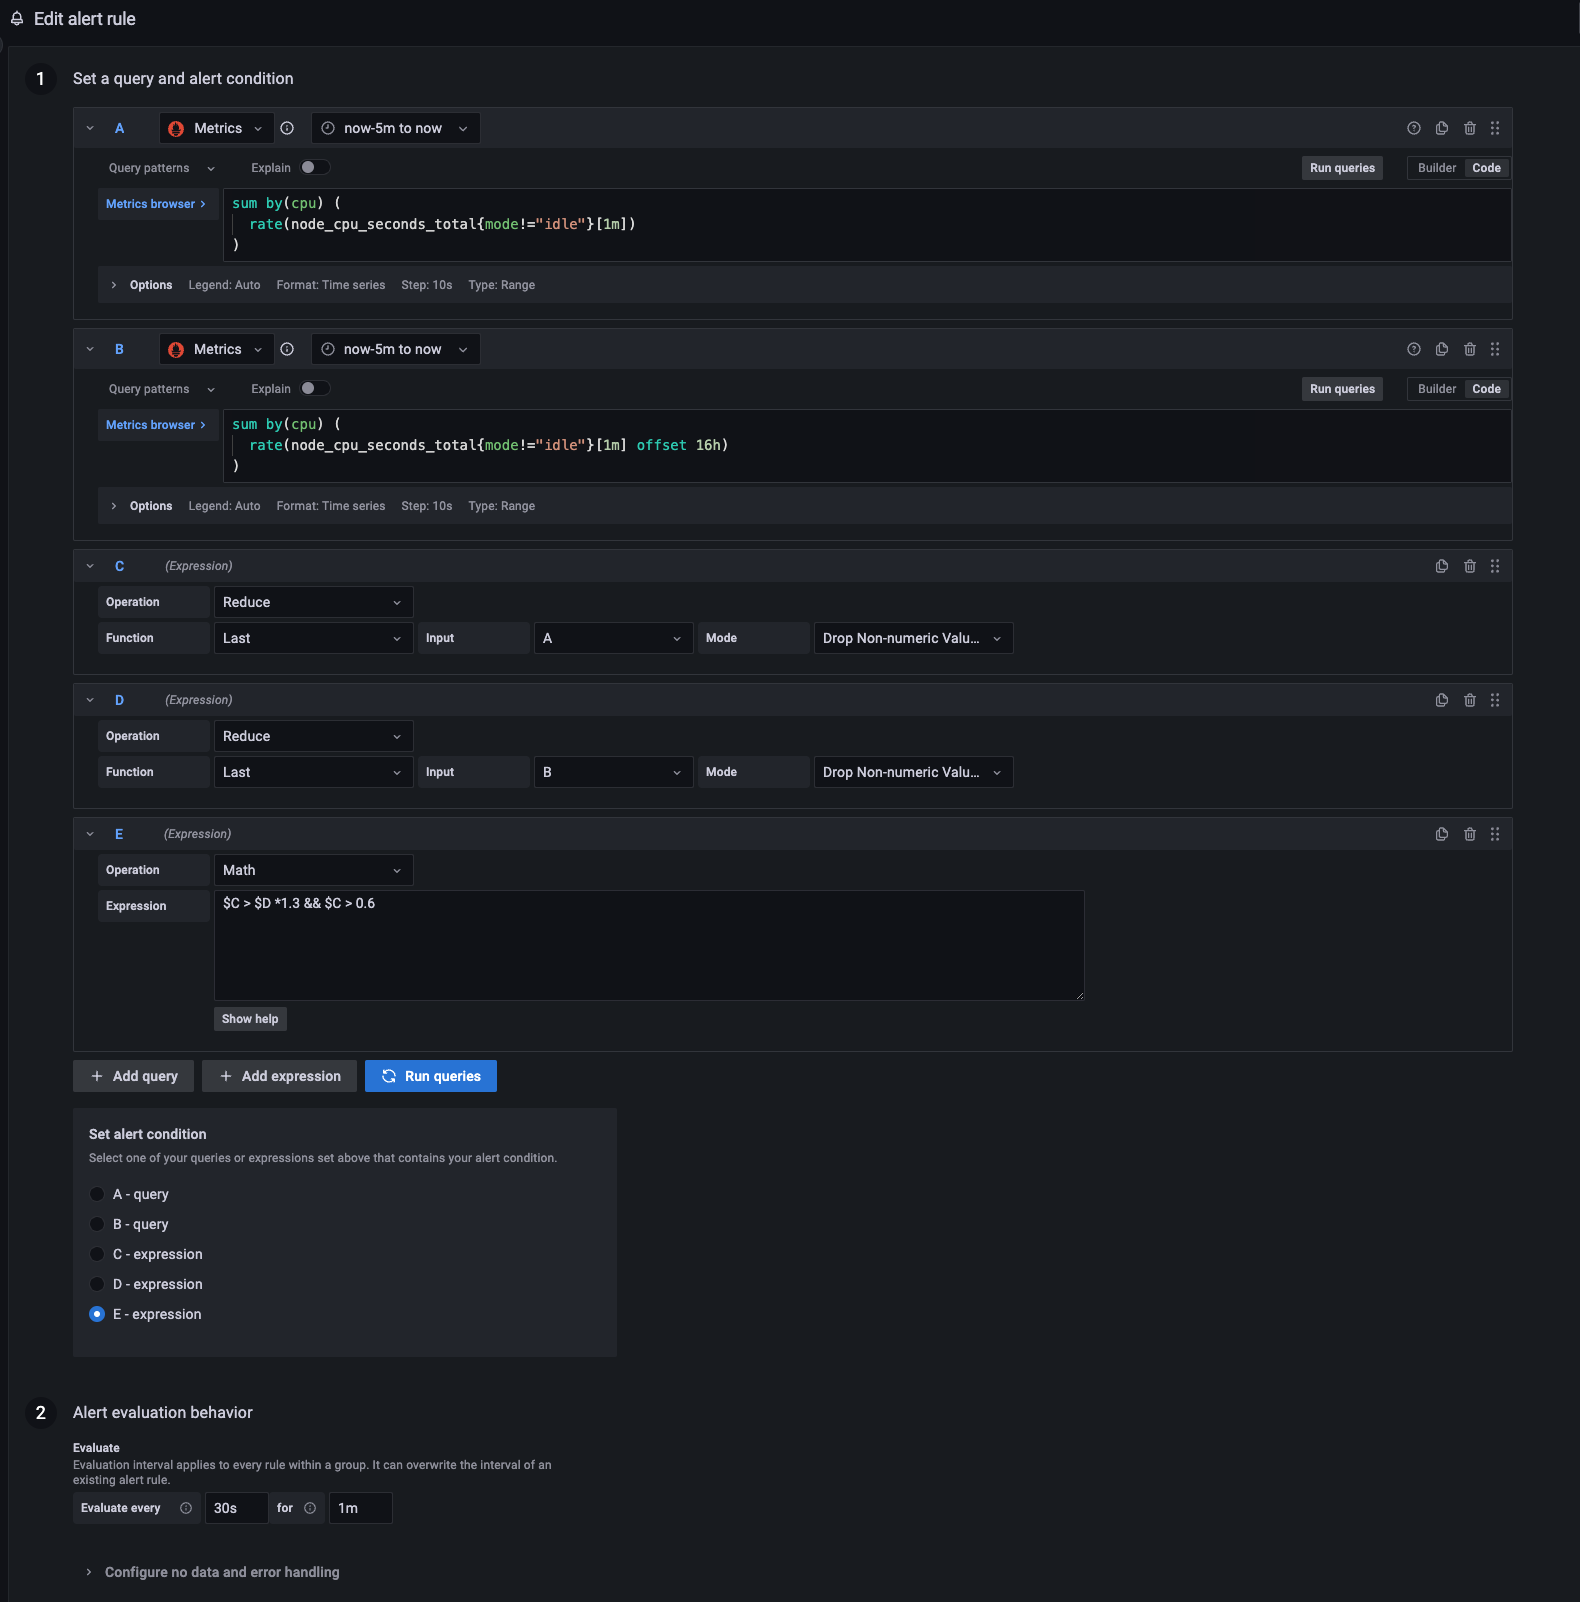
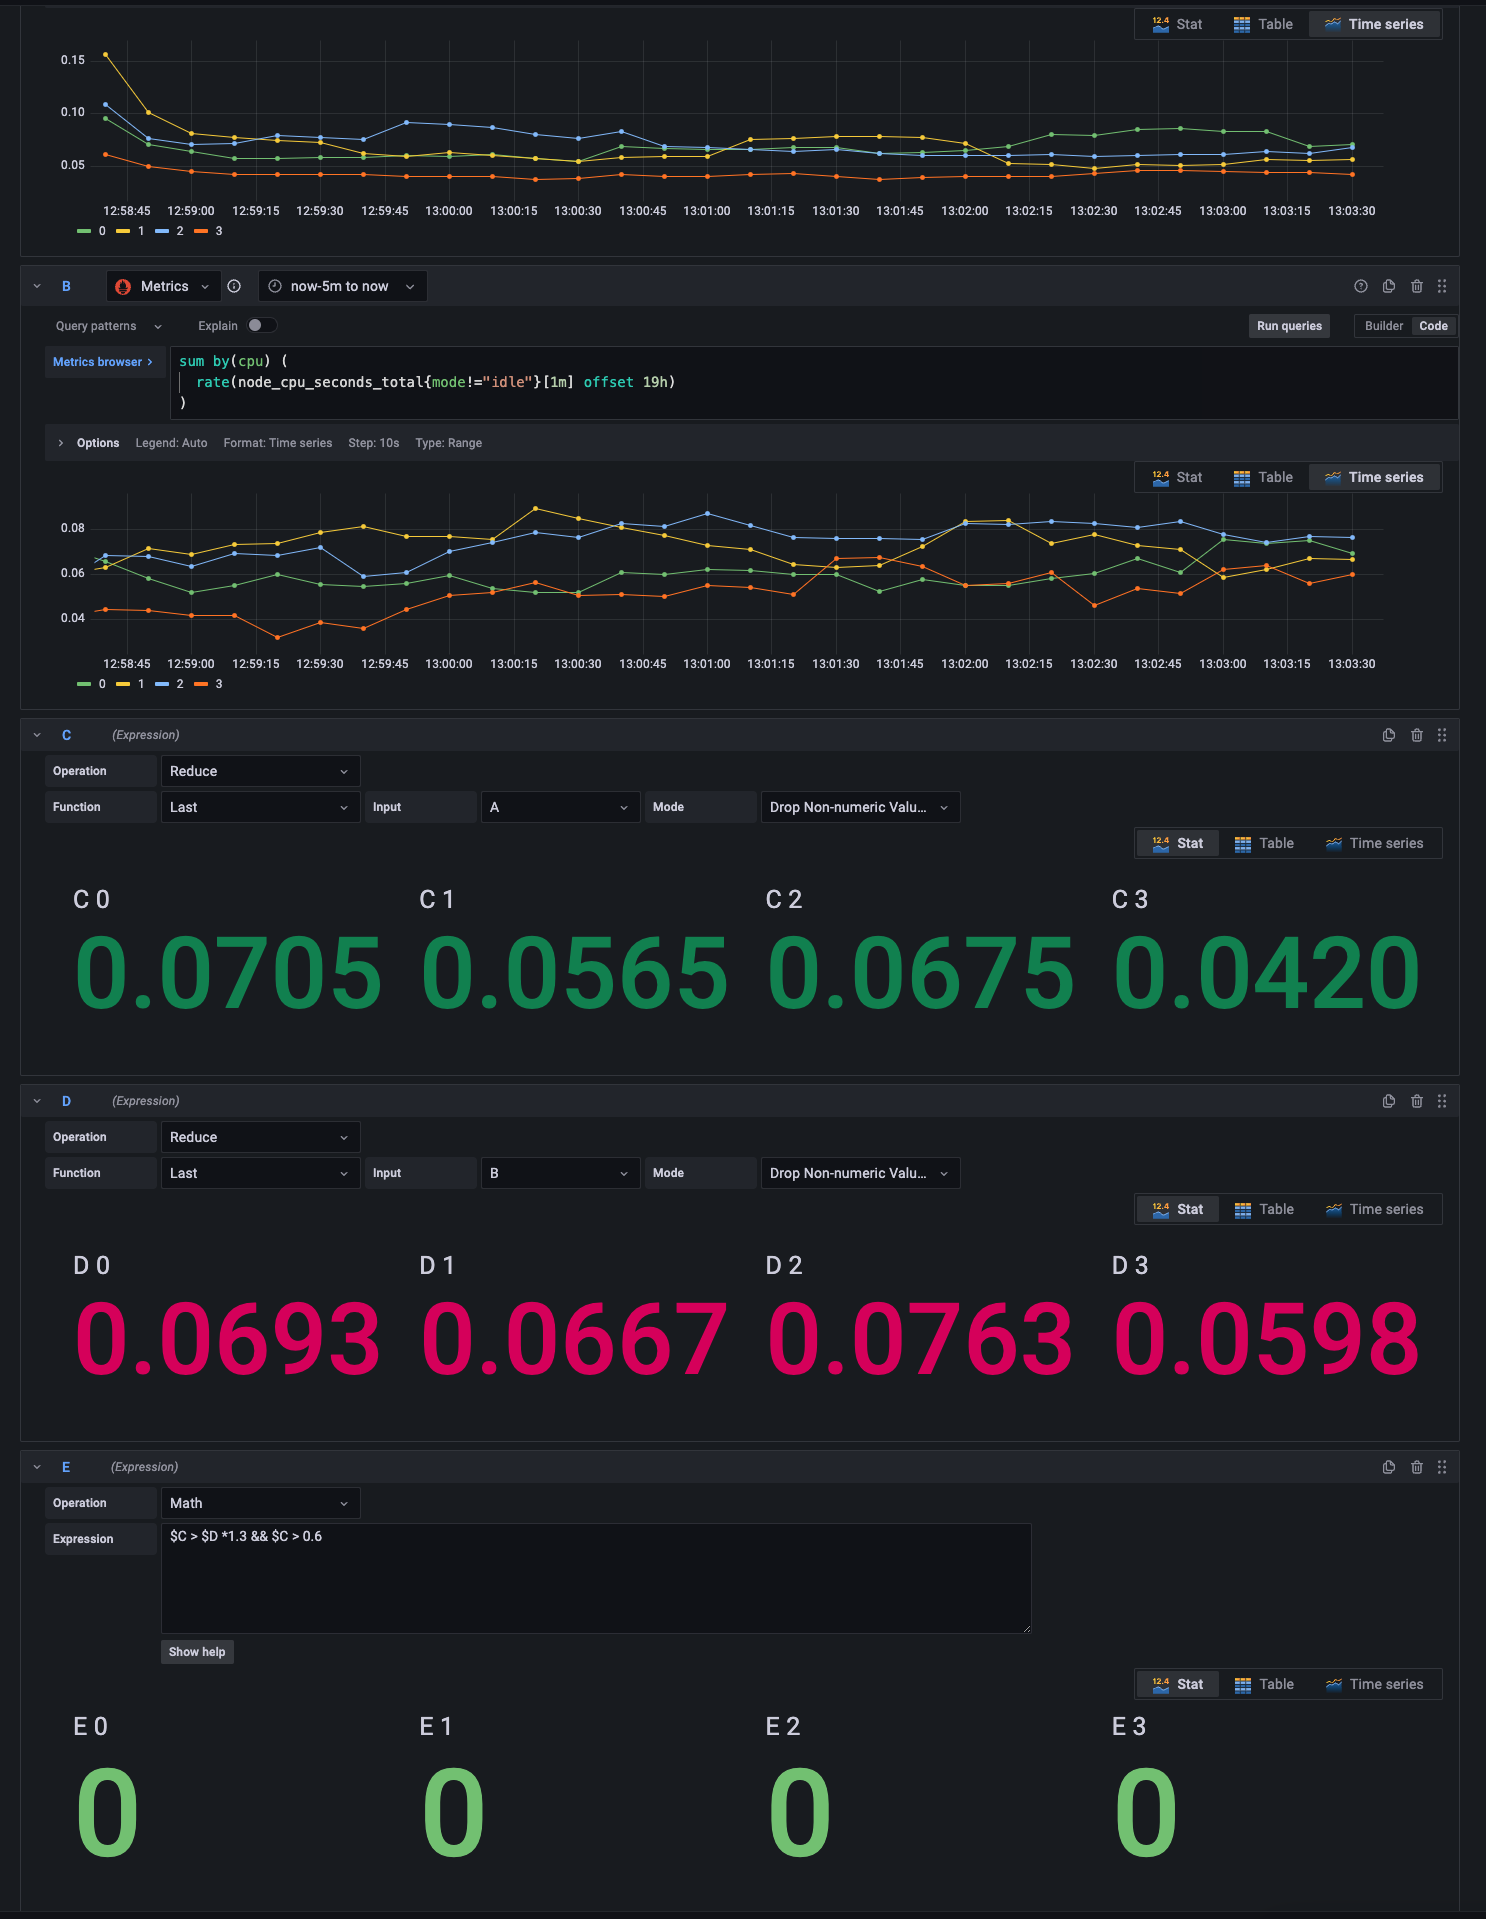
A succesful alert test should look like this:
How this will behave on a Friday night? Am i gonna be paged if the CPU goes beyond 60%? Well, probably no. If the 1-week-ago Friday CPU usage was around 70%-75%, for you to be paged, current value should be between 91%-97.5% (30% above last week) So if current Friday night usage is 70%, 75%, or even up to 90%, no pager.
What about Monday 10:00AM? Same calculation: if typically the value is around 35%-40%, the second part of the condition (CPU above 60%) will be already false, so no page. Since 30% of 40 is 12, both conditions to be paged should be at least: 52% and 60%. Be sure that if in monday night you hit 60%, you will be paged.
A note on edge cases
There are situations where it doesn’t matter if one is using dynamic thresholds, and those are the edge cases:
- CPU is at 99%: SEND ME AN ALERT ASAP
- CPU is at 1%: ALSO ALERT ME ASAP!
Those are good examples of proven value of static thresholds.
Happy Alerting!
Further Reading on MySQL/PostgreSQL Monitoring
- Continuous profiling: Monitoring MySQL with Coroot - eBPF-based observability with FlameGraphs
- Query analytics: Supercharge PMM Query Analytics with Redash - Custom dashboards beyond Grafana

Daniel Guzman Burgos
Colombia
Related Posts

PostgreSQL Internals for the MySQL DBA
You already know how a database works. This is about how a different database works.
March 31, 2026
The Claude Code Engineer
Ship more, type less
March 08, 2026
dbsafe in the Cloud: Safe Schema Changes on AWS Aurora and RDS
TLS connections, Aurora topology detection, and why gh-ost needs extra work here
March 06, 2026
Comments