Supercharge PMM Query Analytics: Using Redash to Optimize Database Performance
Customize QAN, Analyze Query Performance, and Unlock ClickHouse Data with Redash Integration
First part: A new graphical interface
Arguably the best feature from Percona’s PMM is QAN. A lot of users install PMM mostly because that particular module. It is also the one piece that is hard to customize. My understanding is that is a react plugin or a grafana plugin.
Alternative approach: For a different take on MySQL monitoring with automatic eBPF-based discovery and continuous profiling, see Monitoring MySQL with Coroot.
That is a shame, because the data that PMM stores in ClickHouse is a gold mine of query information. One could say “but you can use Grafana, since there is a datasource for ClickHouse”. True, but also not that flexible.
Alternatives
This is the beauty of the open source: is flexible. PMM is built upon several great projects:
- Grafana
- VictoriaMetrics (To replace Prometheus)
- PostgreSQL (To replace SQLite)
- Nginx
- ClickHouse
- Swagger
- Docker
- And of course: Linux
I had the idea for a long time to consume PMMs metrics without Grafana, and specifically with another Open Source project: Redash.
Redash
There are several ways to deploy redash (https://redash.io/) I went with the development setup option, that leaves you with a nice docker compose setup. You can read instructions here: https://github.com/getredash/redash/wiki/Local-development-setup
I deployed it as a neighbor of the pmm-server docker container that i use. This will make easy the whole Datasource setup in redash, since both Prometheus (Actually: VictoriaMetrics) and ClickHouse will run “locally” and can be accessed via the same Bridge network. The only requirement is: expose the ports.
Expose ports without touching the container
There is a workaround to open ports on a running docker container without having to stop, modify and run again the container and is by using SOCAT. For example, to open the ClickHouse port without touching the pmm-server container, run this:
docker run --detach --restart unless-stopped --publish 9000:9000 --link pmm-server:target --name socatpmm alpine/socat tcp-listen:9000,fork,reuseaddr tcp-connect:target:9000
That is just a socat container, linked to the pmm-server, that will act as a proxy that listens the internal port 9000 and expose it, in a bidirectional way.
Second part: Query analysis
What it wanted to do is pretty simple: See the execution time of a query in different moments. This is the dashboard i’ve ended up having:
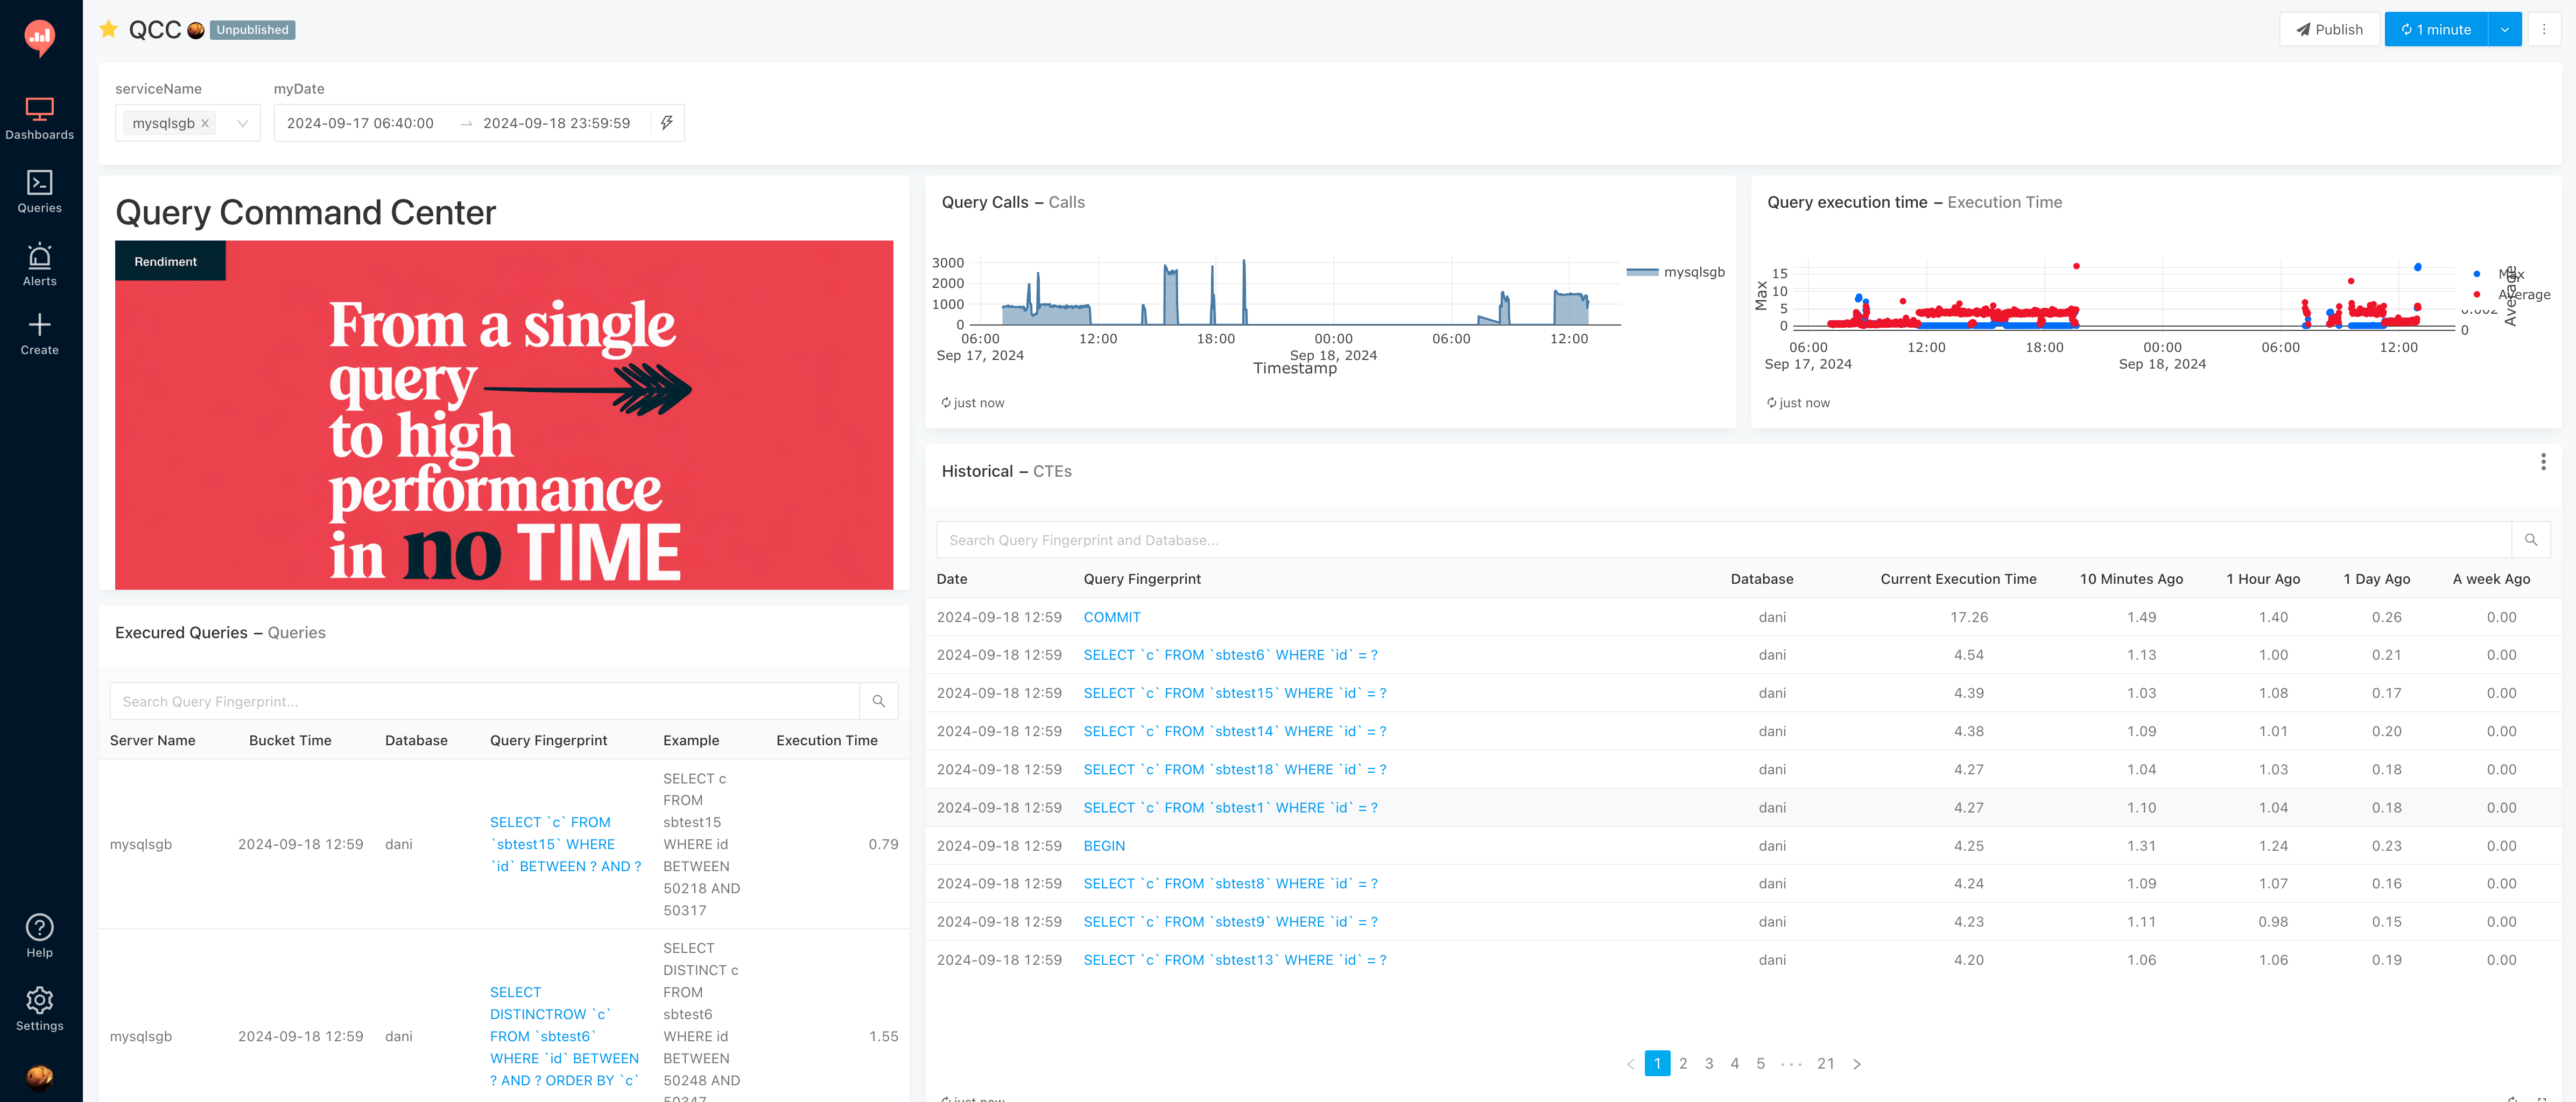
This is what i decide to show:
- A “Query Calls” graph, to see the Queries per amount-of-time
- A “Query execution time” graph to see the average execution time per bucket and the MAX execution time. I would love to see p99’s but that info is not available when the query source is the Performance_Schema
- A table of “Executed Queries” that is pretty much a simpler “show processlist” order by timestamp
- A table of “Historical” queries. And this is the money table
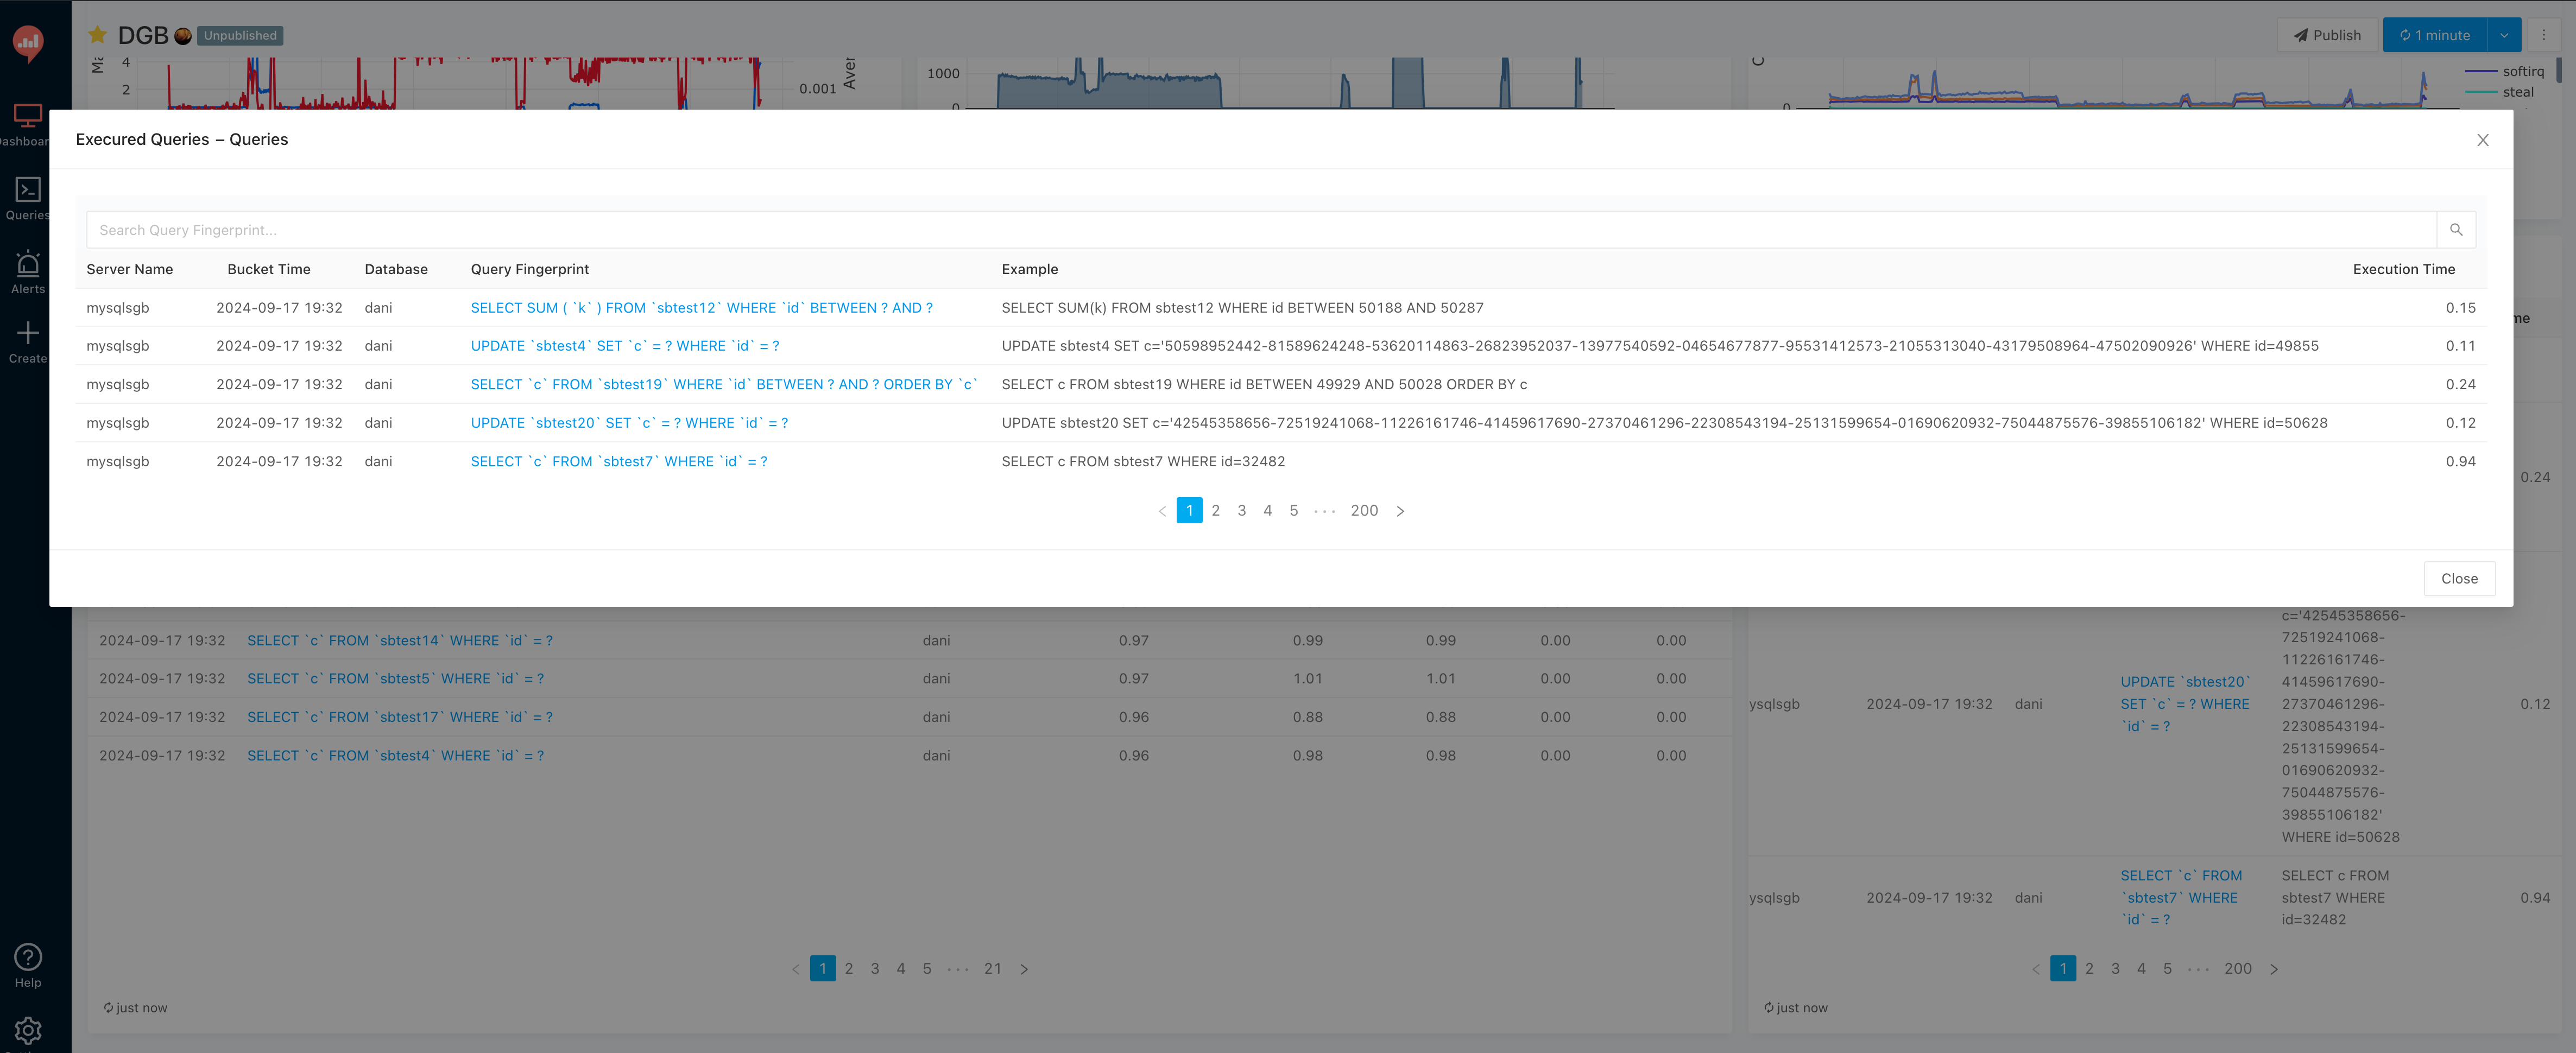
The “Executed Queries” table can be enlarged to have a better view:
Can also be done for the “Historical” table, and this is where starts to get interesting:
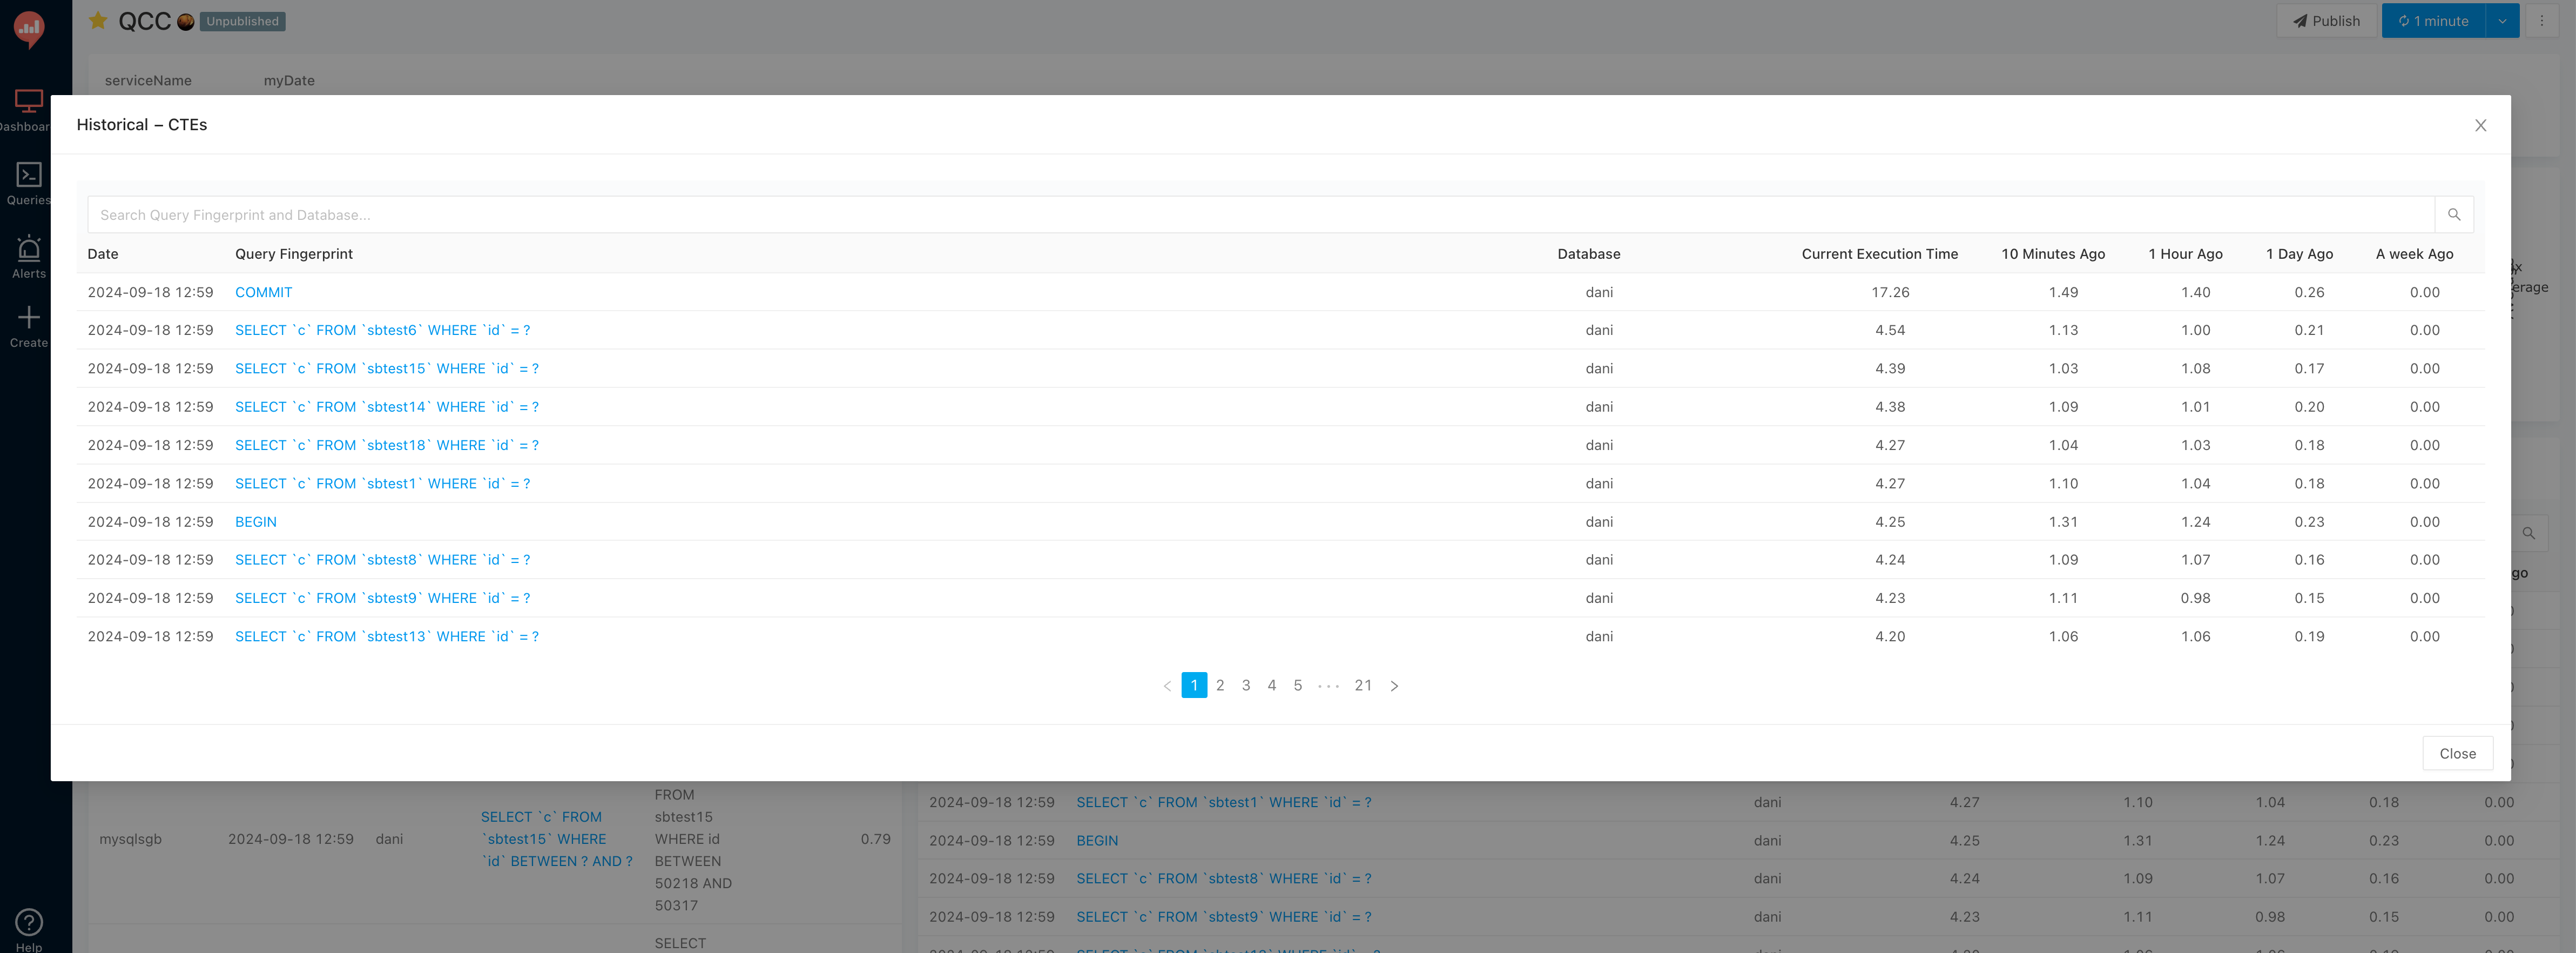
In this particular screenshot, one can see that the last time the COMMIT command was executed, it took 17.26 seconds!!! while a day ago it was a 0.26 seconds command. Even comparing with 10 minutes ago, with 1.49secs, the difference is of one order of magnitude. Worth to clarify that this is a made-up scenario, greatly exaggerated by me, to make the differences huge.
This info is incredible useful to answer the question “Is my query fast or slow?” because it provides context in a single page.
Now, i also made a simple “per-query” dashboard, that looks like this:
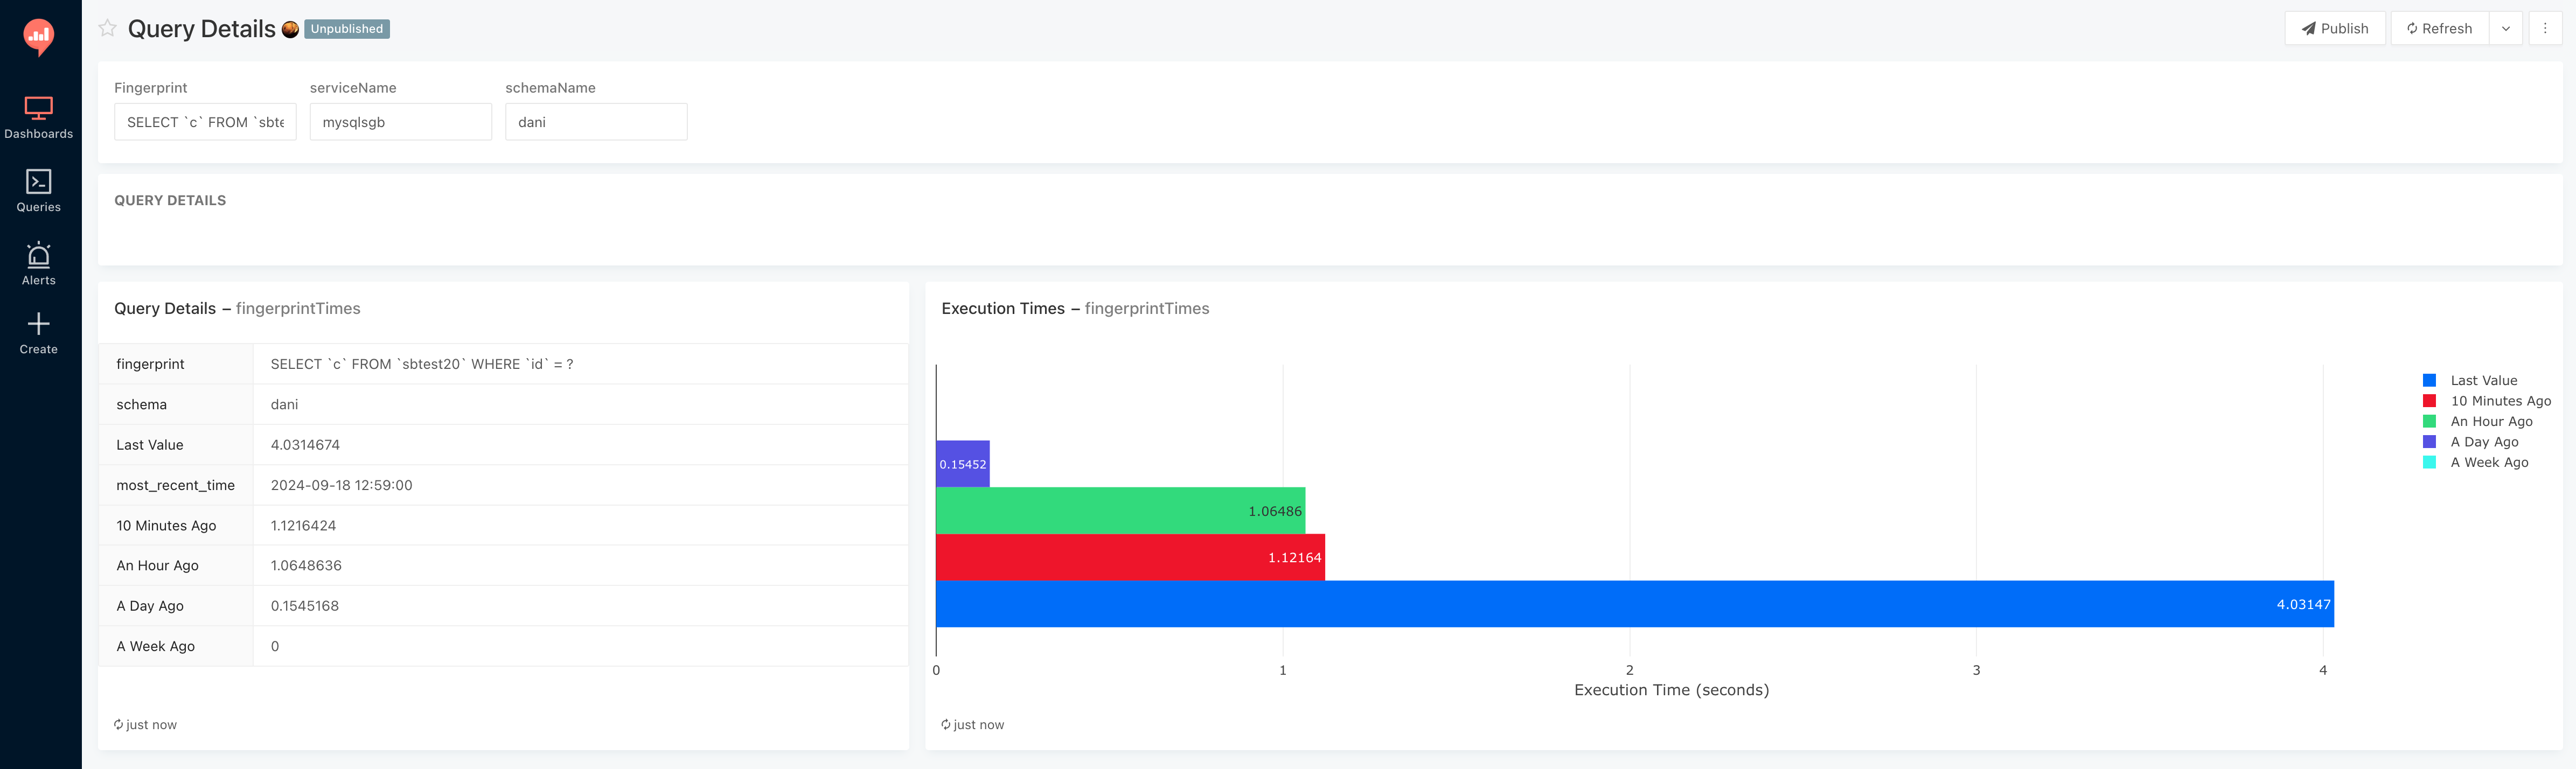
Is easier to spot difference in graphs, and in this case the query fingerprint SELECT c FROM sbtest20 WHERE id = ? is having a 4.03 secs execution time while 10 minutes ago it was 75% less, at 1.12secs.
This are just a couple of examples of what can be done, but the options are huge!
Queries
This are the queries i used against ClickHouse to get the info:
Historical
WITH
time_points AS (
    SELECT
        now() AS current_time,
        subtractMinutes(now(), 10) AS time_10min_ago,
        subtractHours(now(), 1) AS time_1hour_ago,
        subtractHours(now(), 24) AS time_24hours_ago,
        subtractDays(now(), 7) AS time_1week_ago
),
query_metrics AS (
    SELECT
        fingerprint,
        schema,
        service_name,
        argMax(m_query_time_sum, period_start) AS most_recent,
        toTimeZone(max(period_start), 'America/Bogota') AS most_recent_time,
        argMaxIf(m_query_time_sum, period_start, period_start <= (SELECT time_10min_ago FROM time_points)) AS value_10min_ago,
        argMaxIf(m_query_time_sum, period_start, period_start <= (SELECT time_1hour_ago FROM time_points)) AS value_1hour_ago,
        argMaxIf(m_query_time_sum, period_start, period_start <= (SELECT time_24hours_ago FROM time_points)) AS value_24hours_ago,
        argMaxIf(m_query_time_sum, period_start, period_start <= (SELECT time_1week_ago FROM time_points)) AS value_1week_ago
    FROM pmm.metrics
    WHERE fingerprint != ''
      AND service_name IN ()
      AND toTimeZone(period_start,'America/Bogota') >= '' AND toTimeZone(period_start,'America/Bogota') <= ''
    GROUP BY service_name,schema,fingerprint
)
SELECT *
FROM query_metrics
ORDER BY most_recent DESC
Per fingerprint
WITH
time_points AS (
    SELECT
        now() AS current_time,
        subtractMinutes(now(), 10) AS time_10min_ago,
        subtractHours(now(), 1) AS time_1hour_ago,
        subtractHours(now(), 24) AS time_24hours_ago,
        subtractDays(now(), 7) AS time_1week_ago
),
query_metrics AS (
    SELECT
        fingerprint,
        schema,
        argMax(m_query_time_sum, period_start) AS "Last Value",
        toTimeZone(max(period_start), 'America/Bogota') AS most_recent_time,
        argMaxIf(m_query_time_sum, period_start, period_start <= (SELECT time_10min_ago FROM time_points)) AS "10 Minutes Ago",
        argMaxIf(m_query_time_sum, period_start, period_start <= (SELECT time_1hour_ago FROM time_points)) AS "An Hour Ago",
        argMaxIf(m_query_time_sum, period_start, period_start <= (SELECT time_24hours_ago FROM time_points)) AS "A Day Ago",
        argMaxIf(m_query_time_sum, period_start, period_start <= (SELECT time_1week_ago FROM time_points)) AS "A Week Ago"
    FROM pmm.metrics
    WHERE fingerprint LIKE ''
      AND schema LIKE ''
      AND period_start >= (SELECT time_1week_ago FROM time_points)
      AND service_name LIKE ''
    GROUP BY schema, fingerprint
)
SELECT *
FROM query_metrics
Execution times Graph
select
    service_name
    , toTimeZone(period_start, 'America/Bogota') as period_start
    , max(m_query_time_sum) as Max
    , avg(m_query_time_sum/m_query_time_cnt) as Average
from
    pmm.metrics
where
    toTimeZone(period_start,'America/Bogota') >= '' AND toTimeZone(period_start,'America/Bogota') <= ''
    and service_name IN ()
group by service_name, period_start
order by period_start desc;

Daniel Guzman Burgos
Colombia
Related Posts

PostgreSQL Internals for the MySQL DBA
You already know how a database works. This is about how a different database works.
March 31, 2026
The Claude Code Engineer
Ship more, type less
March 08, 2026
dbsafe in the Cloud: Safe Schema Changes on AWS Aurora and RDS
TLS connections, Aurora topology detection, and why gh-ost needs extra work here
March 06, 2026
Comments